N.J. and Pa. among best-represented states on Election Day, according to report
The states are among the top 10 that reflect the voter population of their electorates based on race, age and gender, says a report by the personal finance site WalletHub.
Listen 1:08
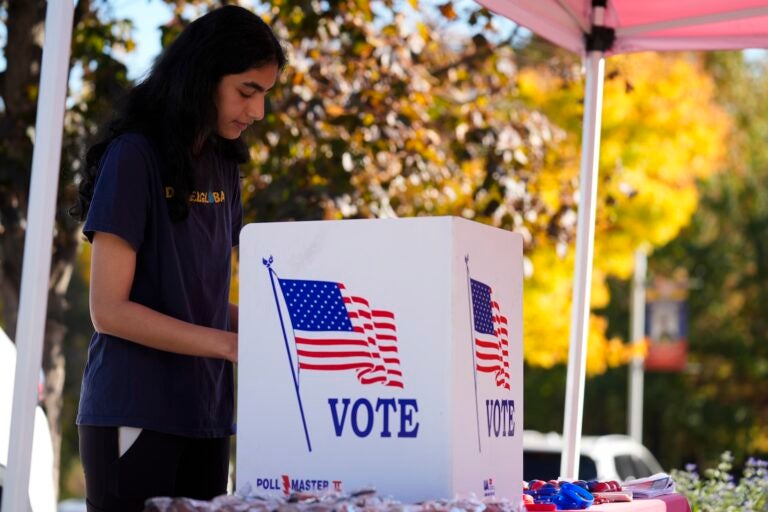
Shreya Srinivasan fills out her mail-in ballot at a Montgomery County voter services mobile location in King of Prussia, Pa., Tuesday, Oct. 22, 2024. (AP Photo/Matt Rourke)
What questions do you have about the 2024 elections? What major issues do you want candidates to address? Let us know.
With Election Day approaching tomorrow, Nov. 5, city officials, political leaders and well-known public figures are urging citizens nationwide to vote, either in person at the polls or by mail.
But low voter turnout among specific demographics — particularly young, minority and low-income citizens — can lead to outcomes that favor those who are more able to vote, leaving others at a disadvantage, according to a report released last month by WalletHub.
The personal finance website pointed out that in many states, the electorate did not fully represent the demographic makeup of the population. The report examined voter representation across all 50 states based on race, age and gender, among other criteria.
While Pennsylvania ranked seventh out of the 50 states studied, New Jersey topped the list with 97% voter representation. This indicates that New Jersey’s electorate more closely reflects its population than Pennsylvania, particularly in terms of race and age among eligible and active voters, according to the report.
Wallethub writer and analyst Chip Lupo told WHYY that one of the key highlights of this study involves determining voter turnout, not just in battleground states like Pennsylvania but across the nation.
“Where Pennsylvania did very, very well was in the racial representation demographic,” said Lupo, noting that the state scored 15th overall in the category. He also said the state ranked first in Black and African American voter representation, bringing its overall electorate representation closer to that of the state’s actual population.
Lupo pointed out that Pennsylvania also placed 14th for voters age 18–44 and 10th for voters 65 and older.
“And I think you find that to be the case pretty much in a lot of state, the older voters tend to turn out more in droves, particularly on Election Day, because one of the main talking points in the election cycle is candidate A is going to do this to your Social Security, candidate B is going to do this to your Medicare. So, it’s hot button issues like that that tend to drive these older voters to the polls,” Lupo added.
Lupo stated that increasing engagement with different demographics could lead to higher voter turnout.
“I think those numbers also reflect getting more Asian and Hispanic voters, get them more engaged and get them to the point where their numbers are matching the numbers of those of the African American and white voters,” Lupo said.
Delaware placed 31st on the list of voter representation, with 91% for age and 97% for gender demographics.
WalletHub also compared voters’ employment status, family income, education and marital status in its report.

Get daily updates from WHYY News!
WHYY is your source for fact-based, in-depth journalism and information. As a nonprofit organization, we rely on financial support from readers like you. Please give today.


