Results of Philly’s citizen science heat mapping study expected this spring
The study is expected to inform solutions to keep Philadelphians safe from dangerous heat waves made worse by climate change.

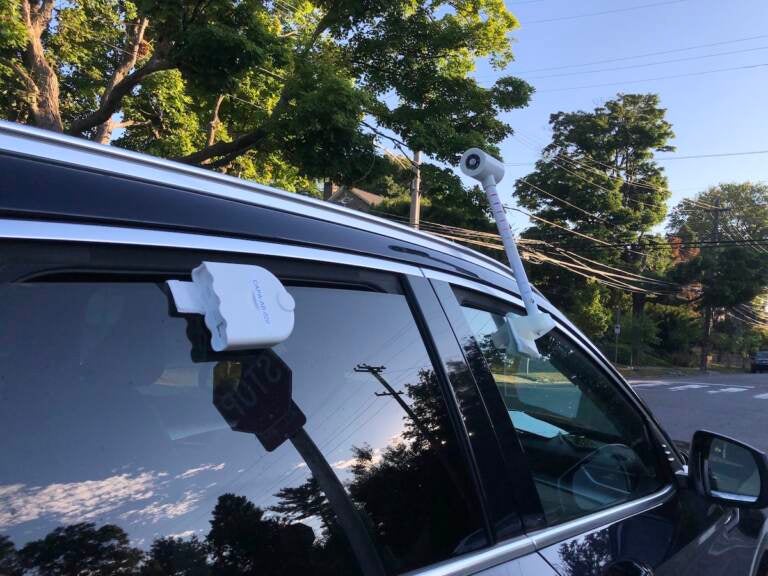
Temperature and air quality sensors attached to Carolyn Martin's car. (Sophia Schmidt/WHYY)
Philadelphia participated in a citizen science heat mapping project this summer — along with over a dozen other communities across the country. Three months later, some preliminary results are in.
Fifty Philadelphians drove around the city with heat and air quality sensors attached to their cars one day in July. The goal was to map urban heat islands, or places that get hotter in the summer than areas with more shade and less concrete.
The hottest temperature they measured was 95 degrees, according to CAPA Strategies, the company that partnered with the National Oceanic and Atmospheric Administration (NOAA) on the project. The greatest difference between areas of the city was over 10 degrees.
“Communities will receive a report outlining where the hottest areas in the community are,” said Sarah Kapnick, chief scientist for NOAA, during a webinar Thursday. “Campaign communities are then able to take this data and work with decision makers to implement solutions, hopefully addressing areas that have stark temperature differences.”
Philadelphians will have to wait for the full results, which the The Academy of Natural Sciences of Drexel University — the local project lead — plans to release in the spring. They’ll include detailed temperature maps, and the data will be open-source, meaning anyone can download it and use it.
Philly was one of just two communities that also collected data on air quality.
Extreme heat is the lead cause of weather-related death, according to the EPA. The data could inform solutions to keep Philadelphians safe.
Temperature disparities of up to 22 degrees — in part due to differences in tree cover and the built environment — have already been documented in Philly, and climate change is making extreme heat worse. The average summer temperature in Philly has already risen about 3 degrees Fahrenheit in the last 50 years.
“Climate projections indicate that temperatures will continue to rise in many communities across the country. So addressing extreme heat in communities is imperative,” she said.
Communities have used data from NOAA’s heat mapping campaigns to direct tree planting efforts, NOAA said. Others said during Thursday’s webinar that they plan to use it to locate heat relief centers, target awareness efforts, or do oral history projects.

Subscribe to PlanPhilly
WHYY is your source for fact-based, in-depth journalism and information. As a nonprofit organization, we rely on financial support from readers like you. Please give today.


