Maps: Which Philly neighborhoods have the most storefront businesses?
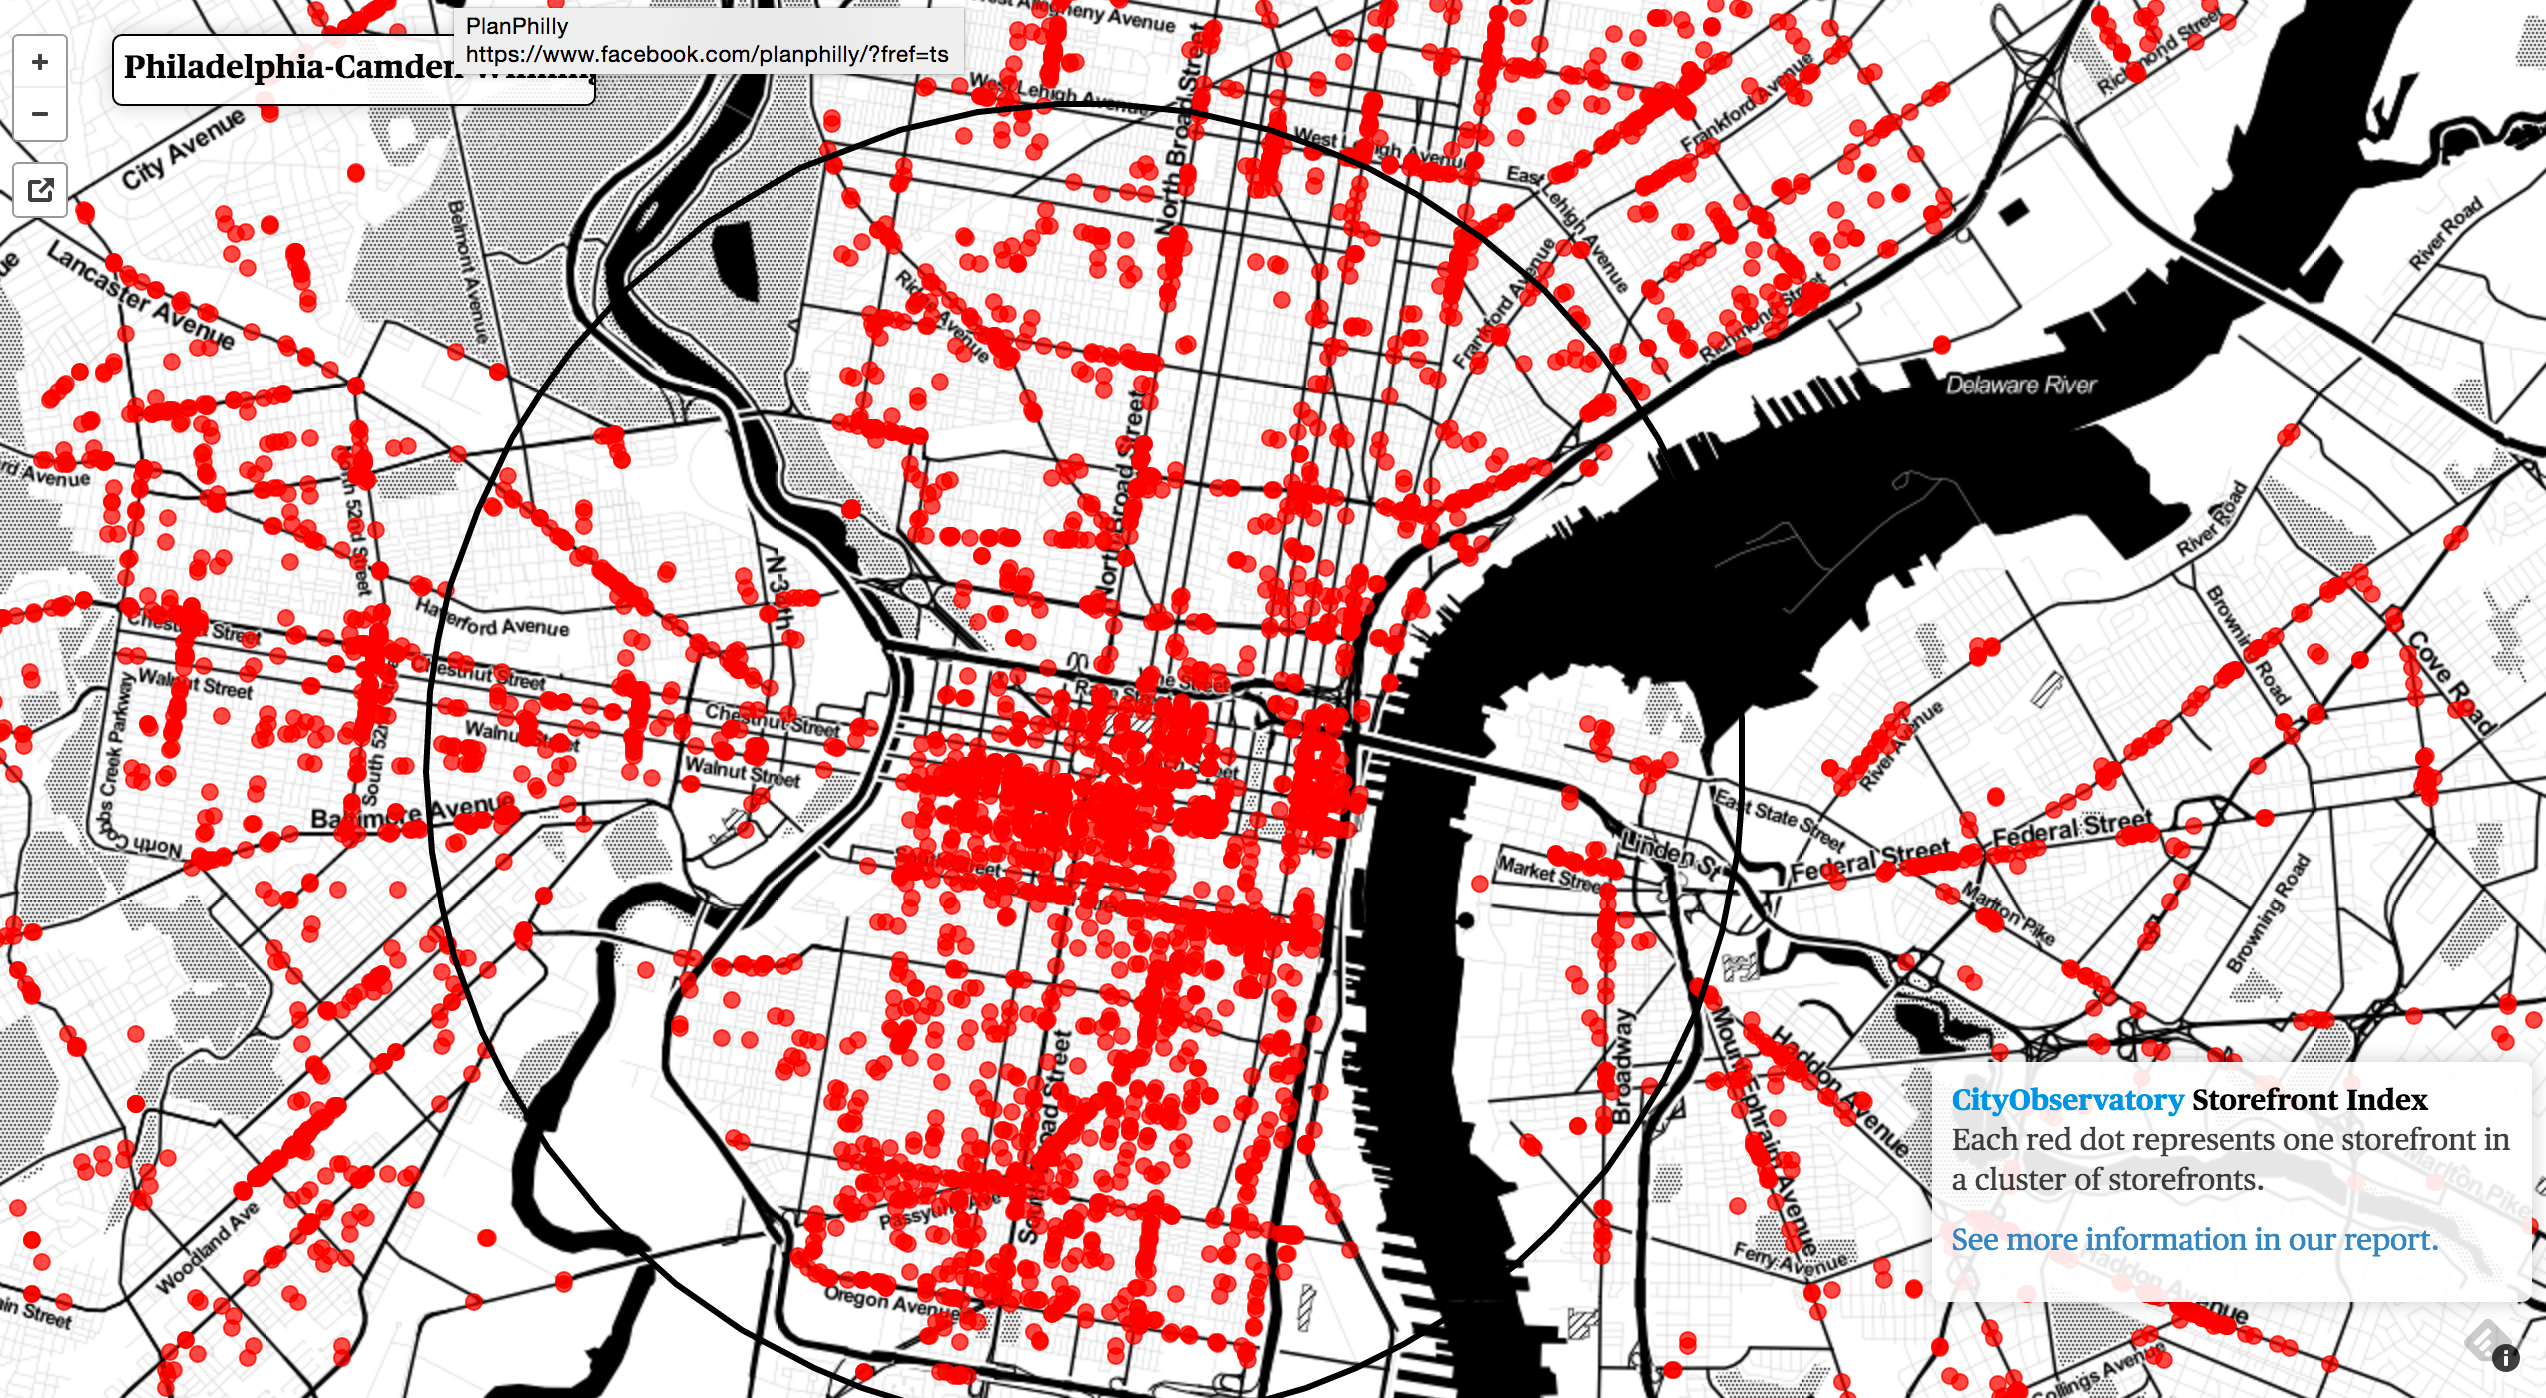
As the Kenney administration develops its strategy for neighborhood commercial corridors beyond Center City, a new Storefront Index created by City Observatory could provide a helpful way of visualizing the places that need more attention.
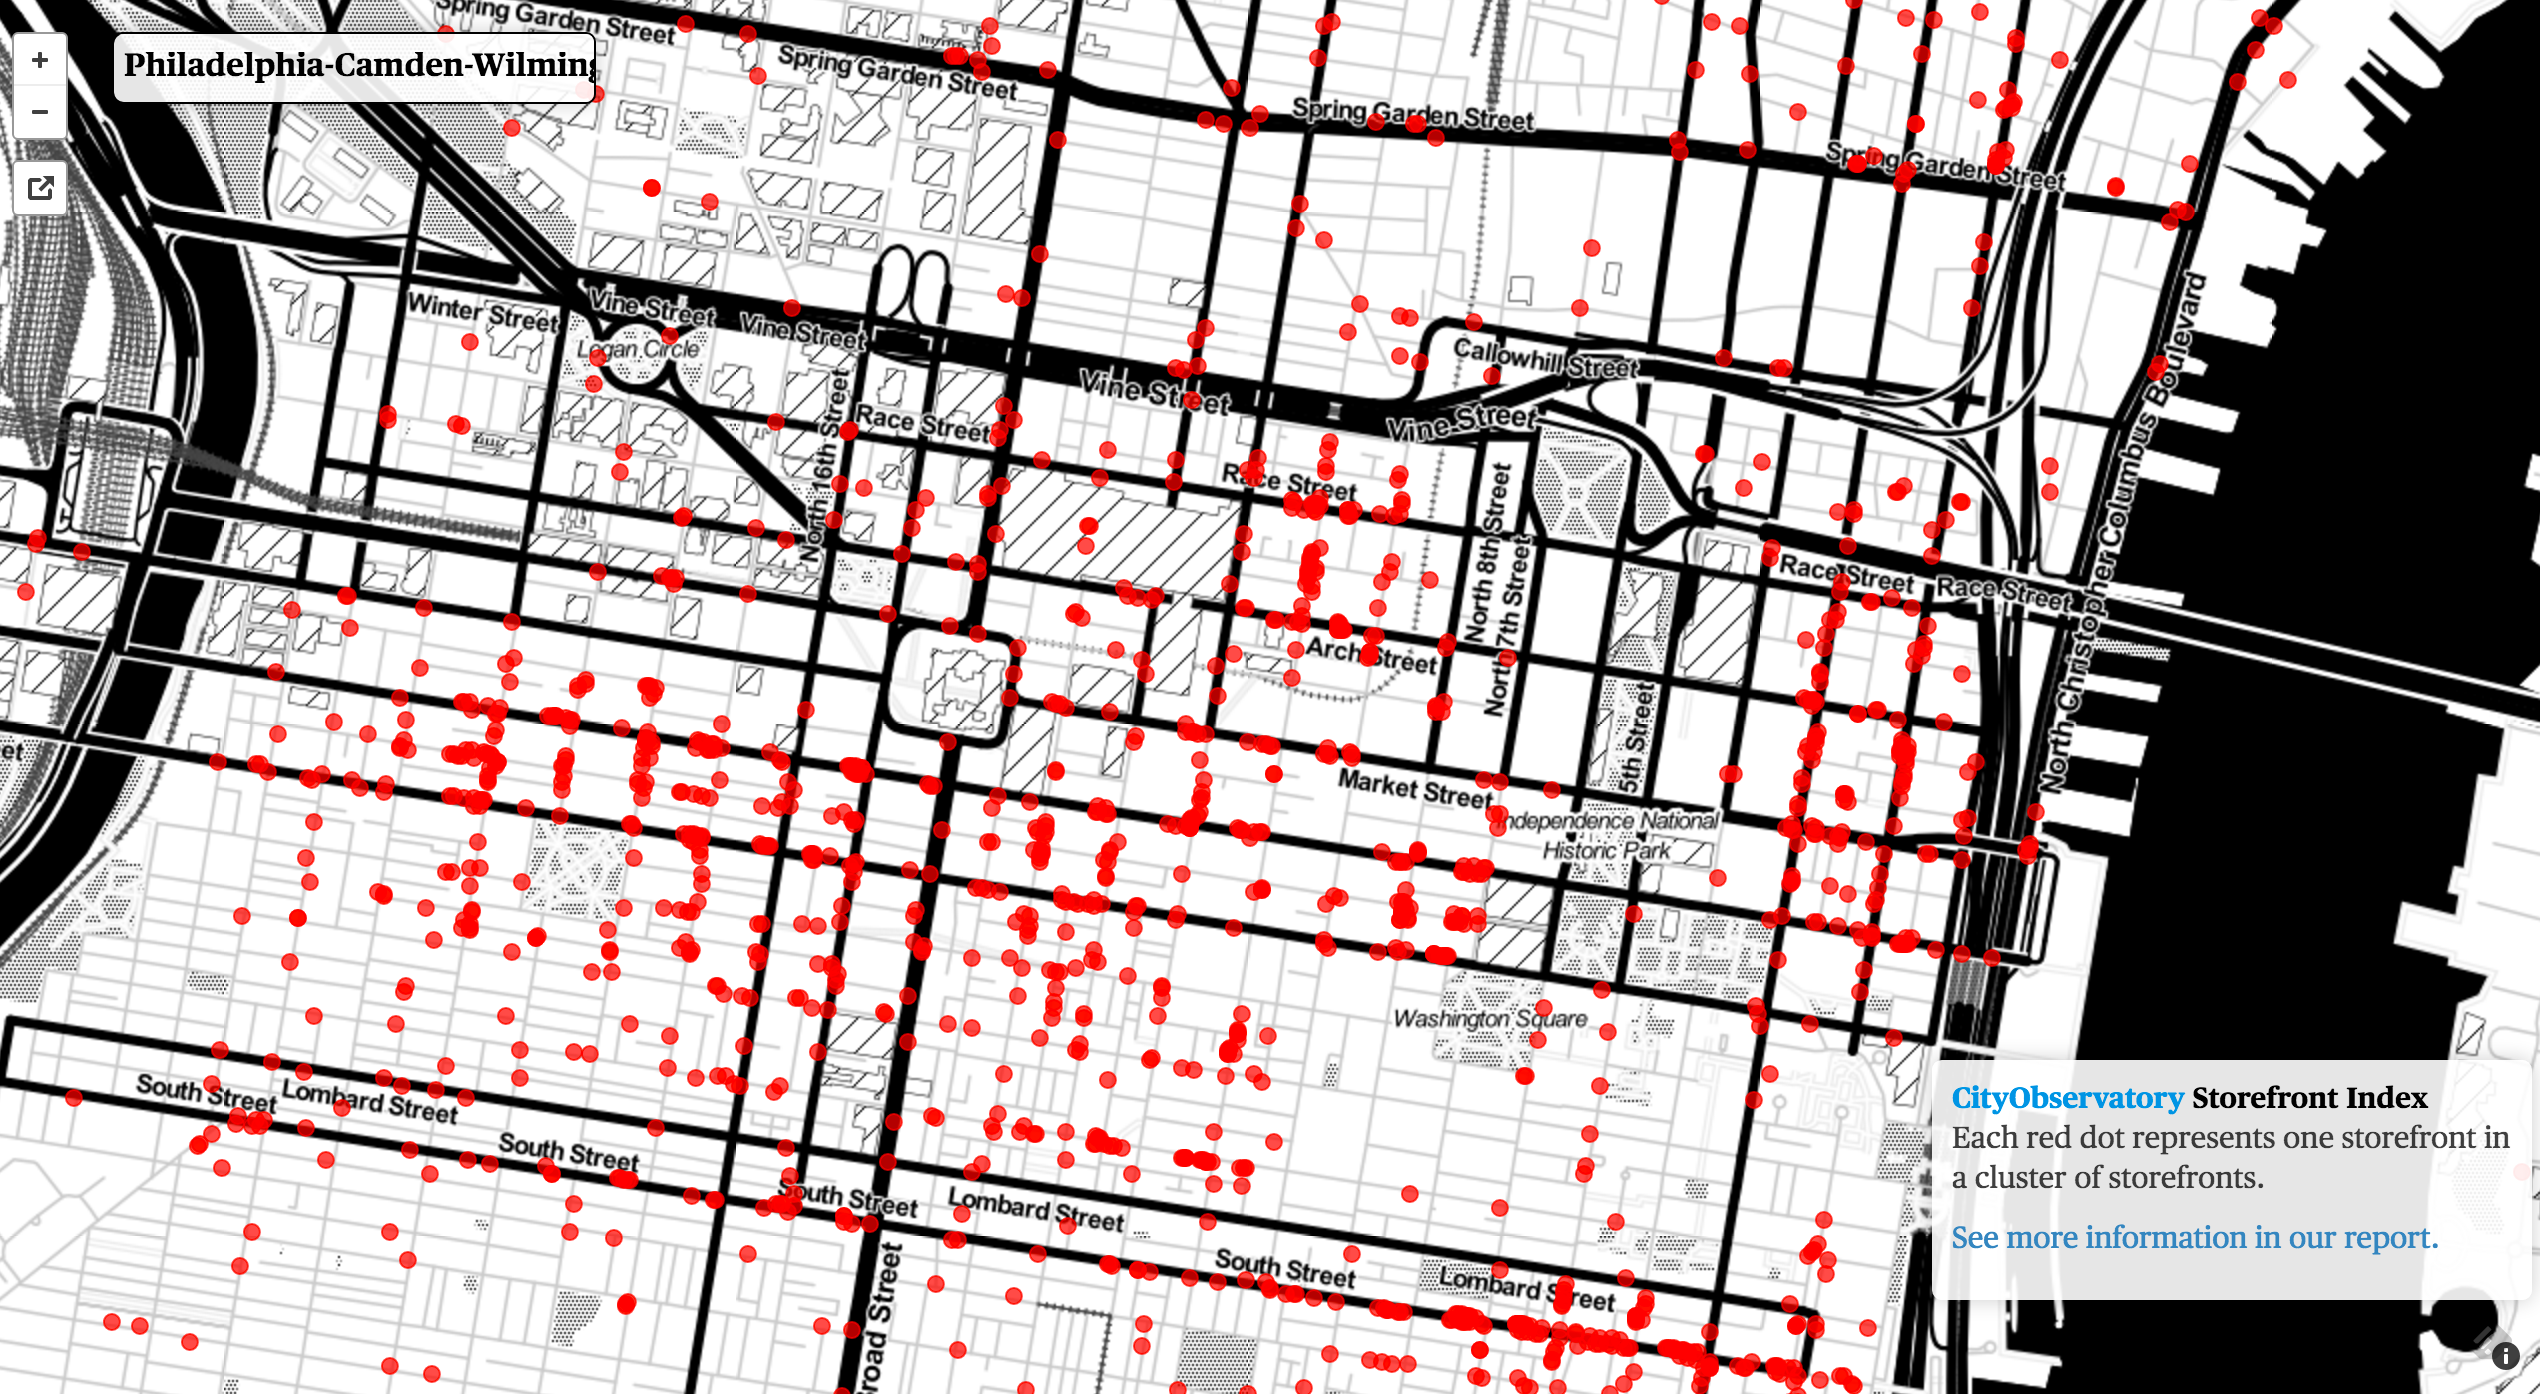
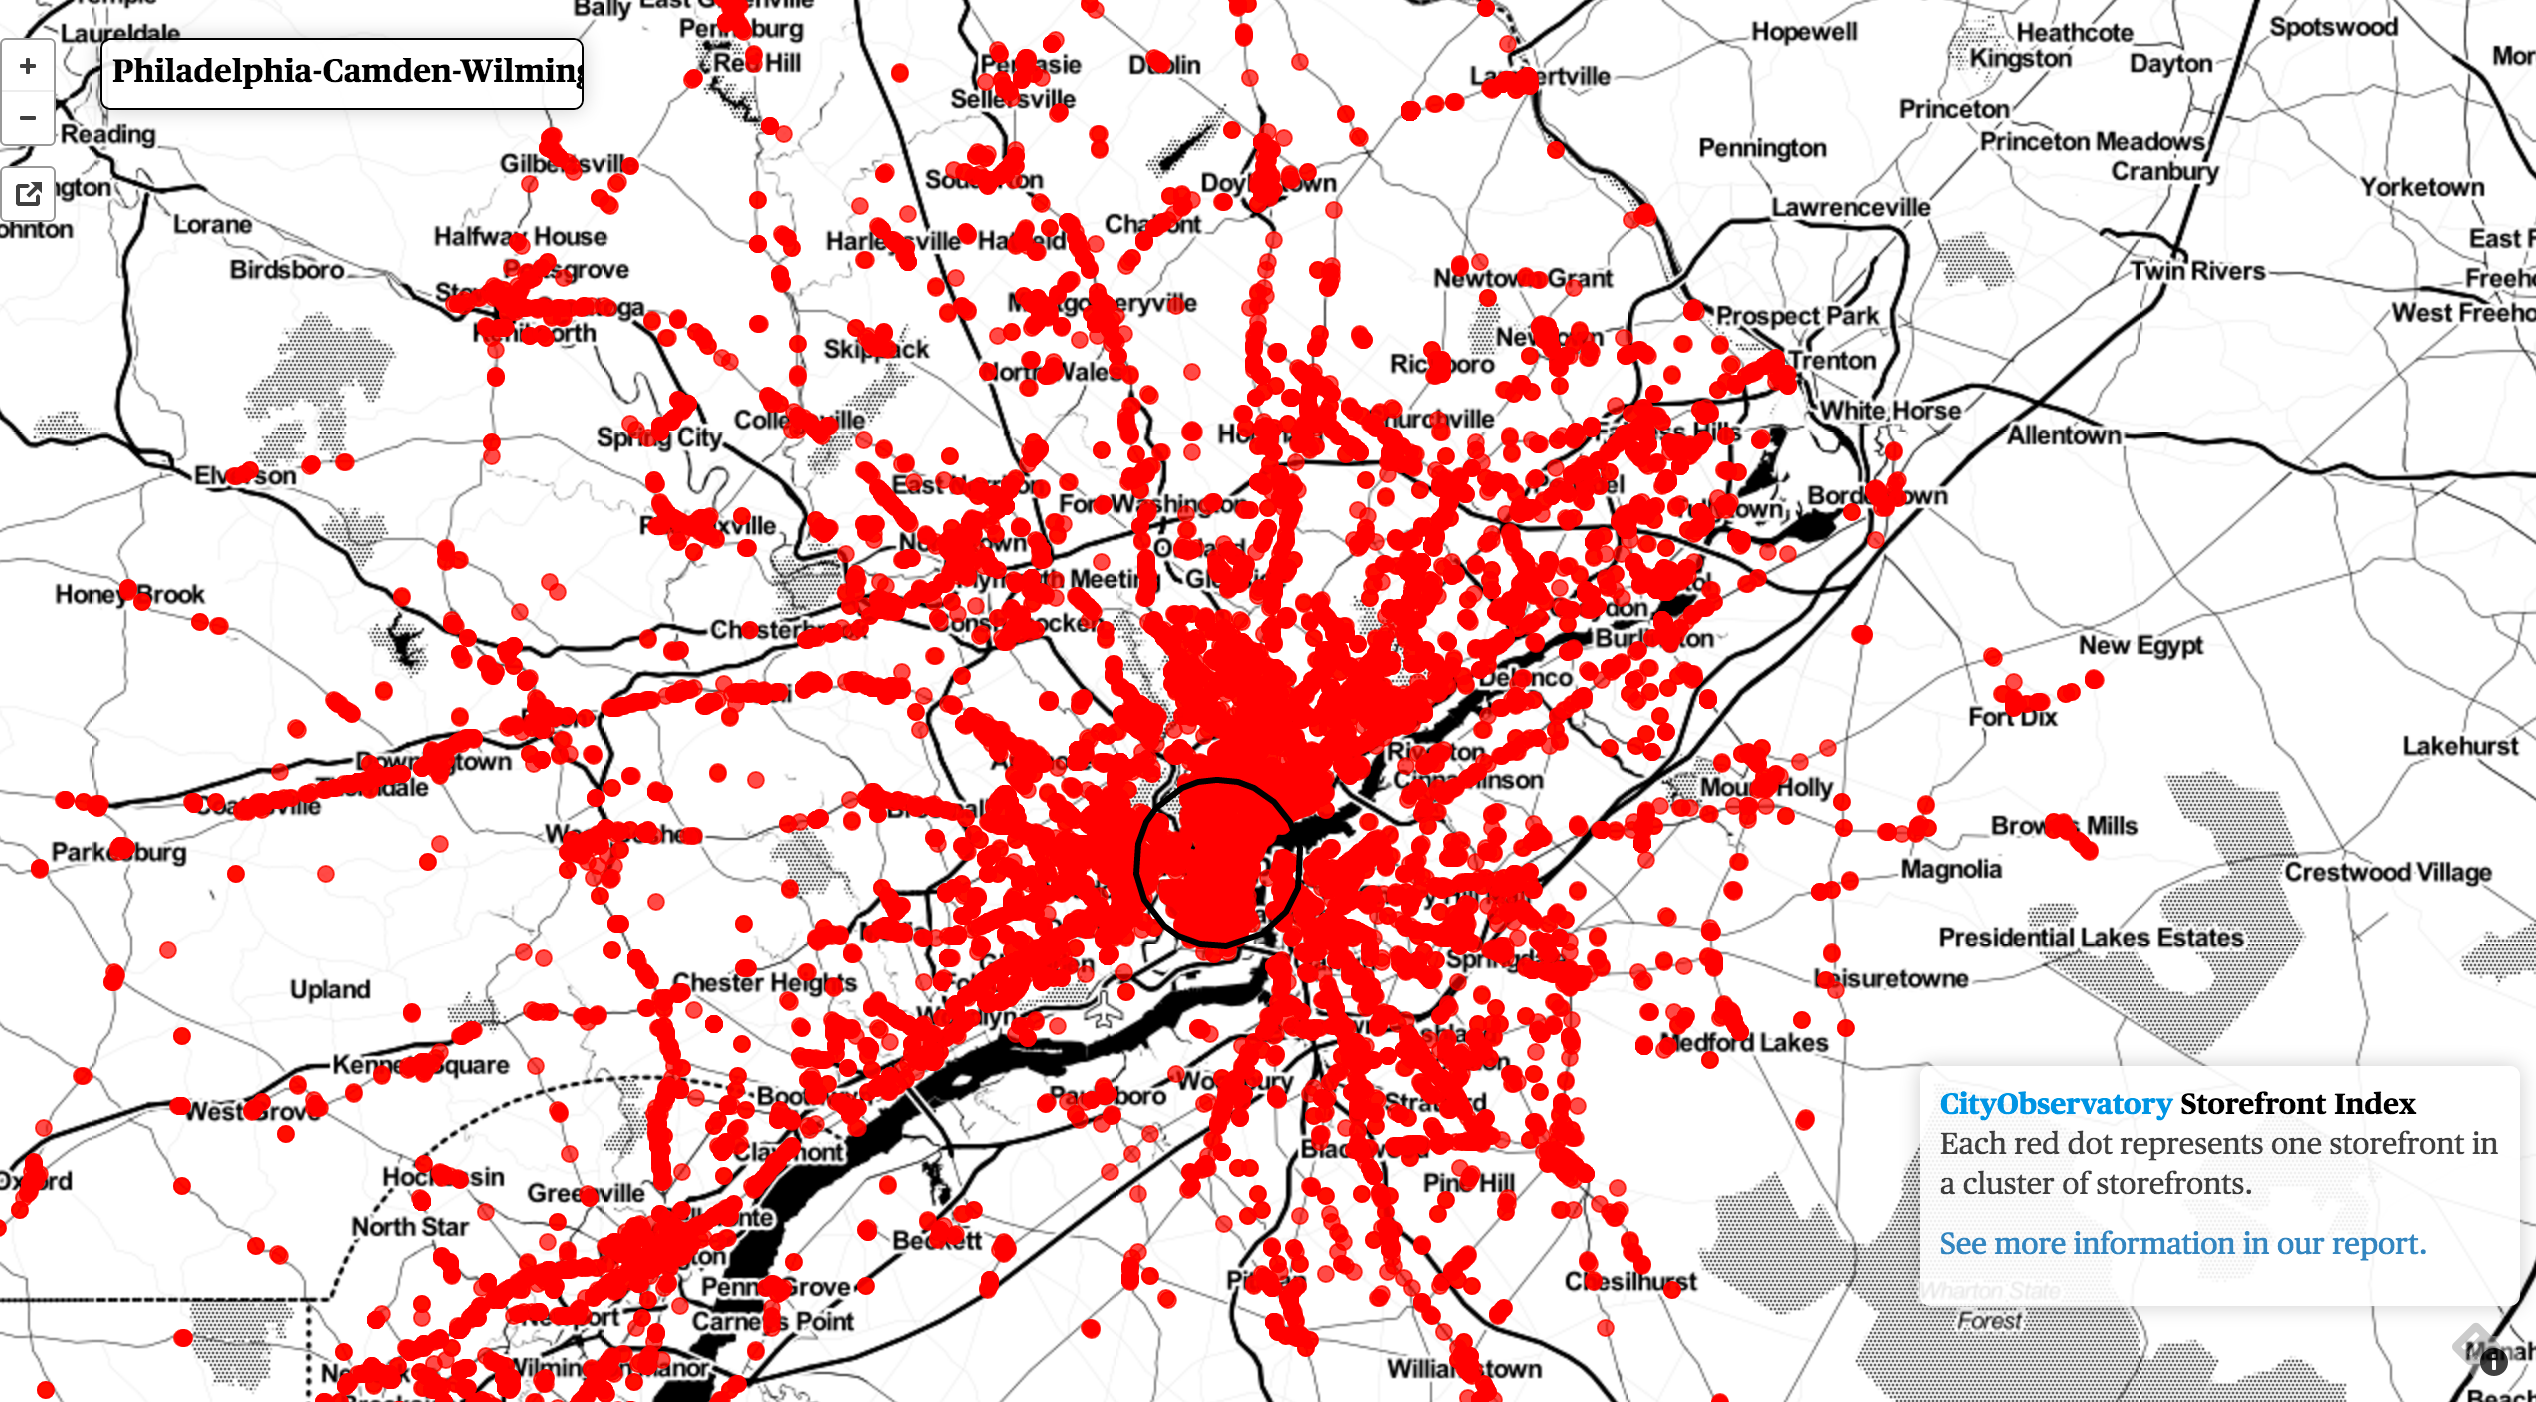
Using 2014 data compiled from national business directories, researchers Joe Cortwright and Dillon Mahmoudi created an index of customer-facing businesses (44 categories in all, including grocery stores, bars and restaurants, barbers, hardware stores and more) for the nation’s 51 largest metropolitan regions, and mapped the results to reveal where these storefronts are clustered.
To help illustrate the clustering effect, the Storefront Index includes only storefronts that are within 100 meters of another storefront, or roughly a one block radius.
Why is this such useful information?
Neighborhood businesses depend on foot traffic, and some studies have found that the number of businesses per acre is the most important predictor of whether people are likely to walk in their neighborhoods.
Places with clusters of storefronts are also likely to have stronger residential real estate markets, as walkable urban neighborhoods are at a premium nationally. Metrics like Walk Score have become one of the factors people consider when choosing a neighborhood, and the scores are mostly determined by the volume of amenities within walking distance.
One upshot is that the zoning power gives city government direct influence over the density of residents and storefronts allowed within a given area. Zoning to allow more storefronts doesn’t always guarantee that new businesses will open, but the visualization uncovers where commercial corridors seem to “want” to expand, and where land use could be more supportive of this.
In growing neighborhoods, zoning for greater density or mixed uses can support a greater concentration of storefronts and nearby customers, but this isn’t always universally well-regarded among residents or elected officials.
Council President Darrell Clarke recently indicated an interest in increasing statutory parking minimums in response to increasing residential density in some neighborhoods, and a disagreement over how densely to rezone the Point Breeze Avenue commercial corridor was one of the more substantive differences between Councilman Kenyatta Johnson and Ori Feibush in last year’s 2nd Council District election.
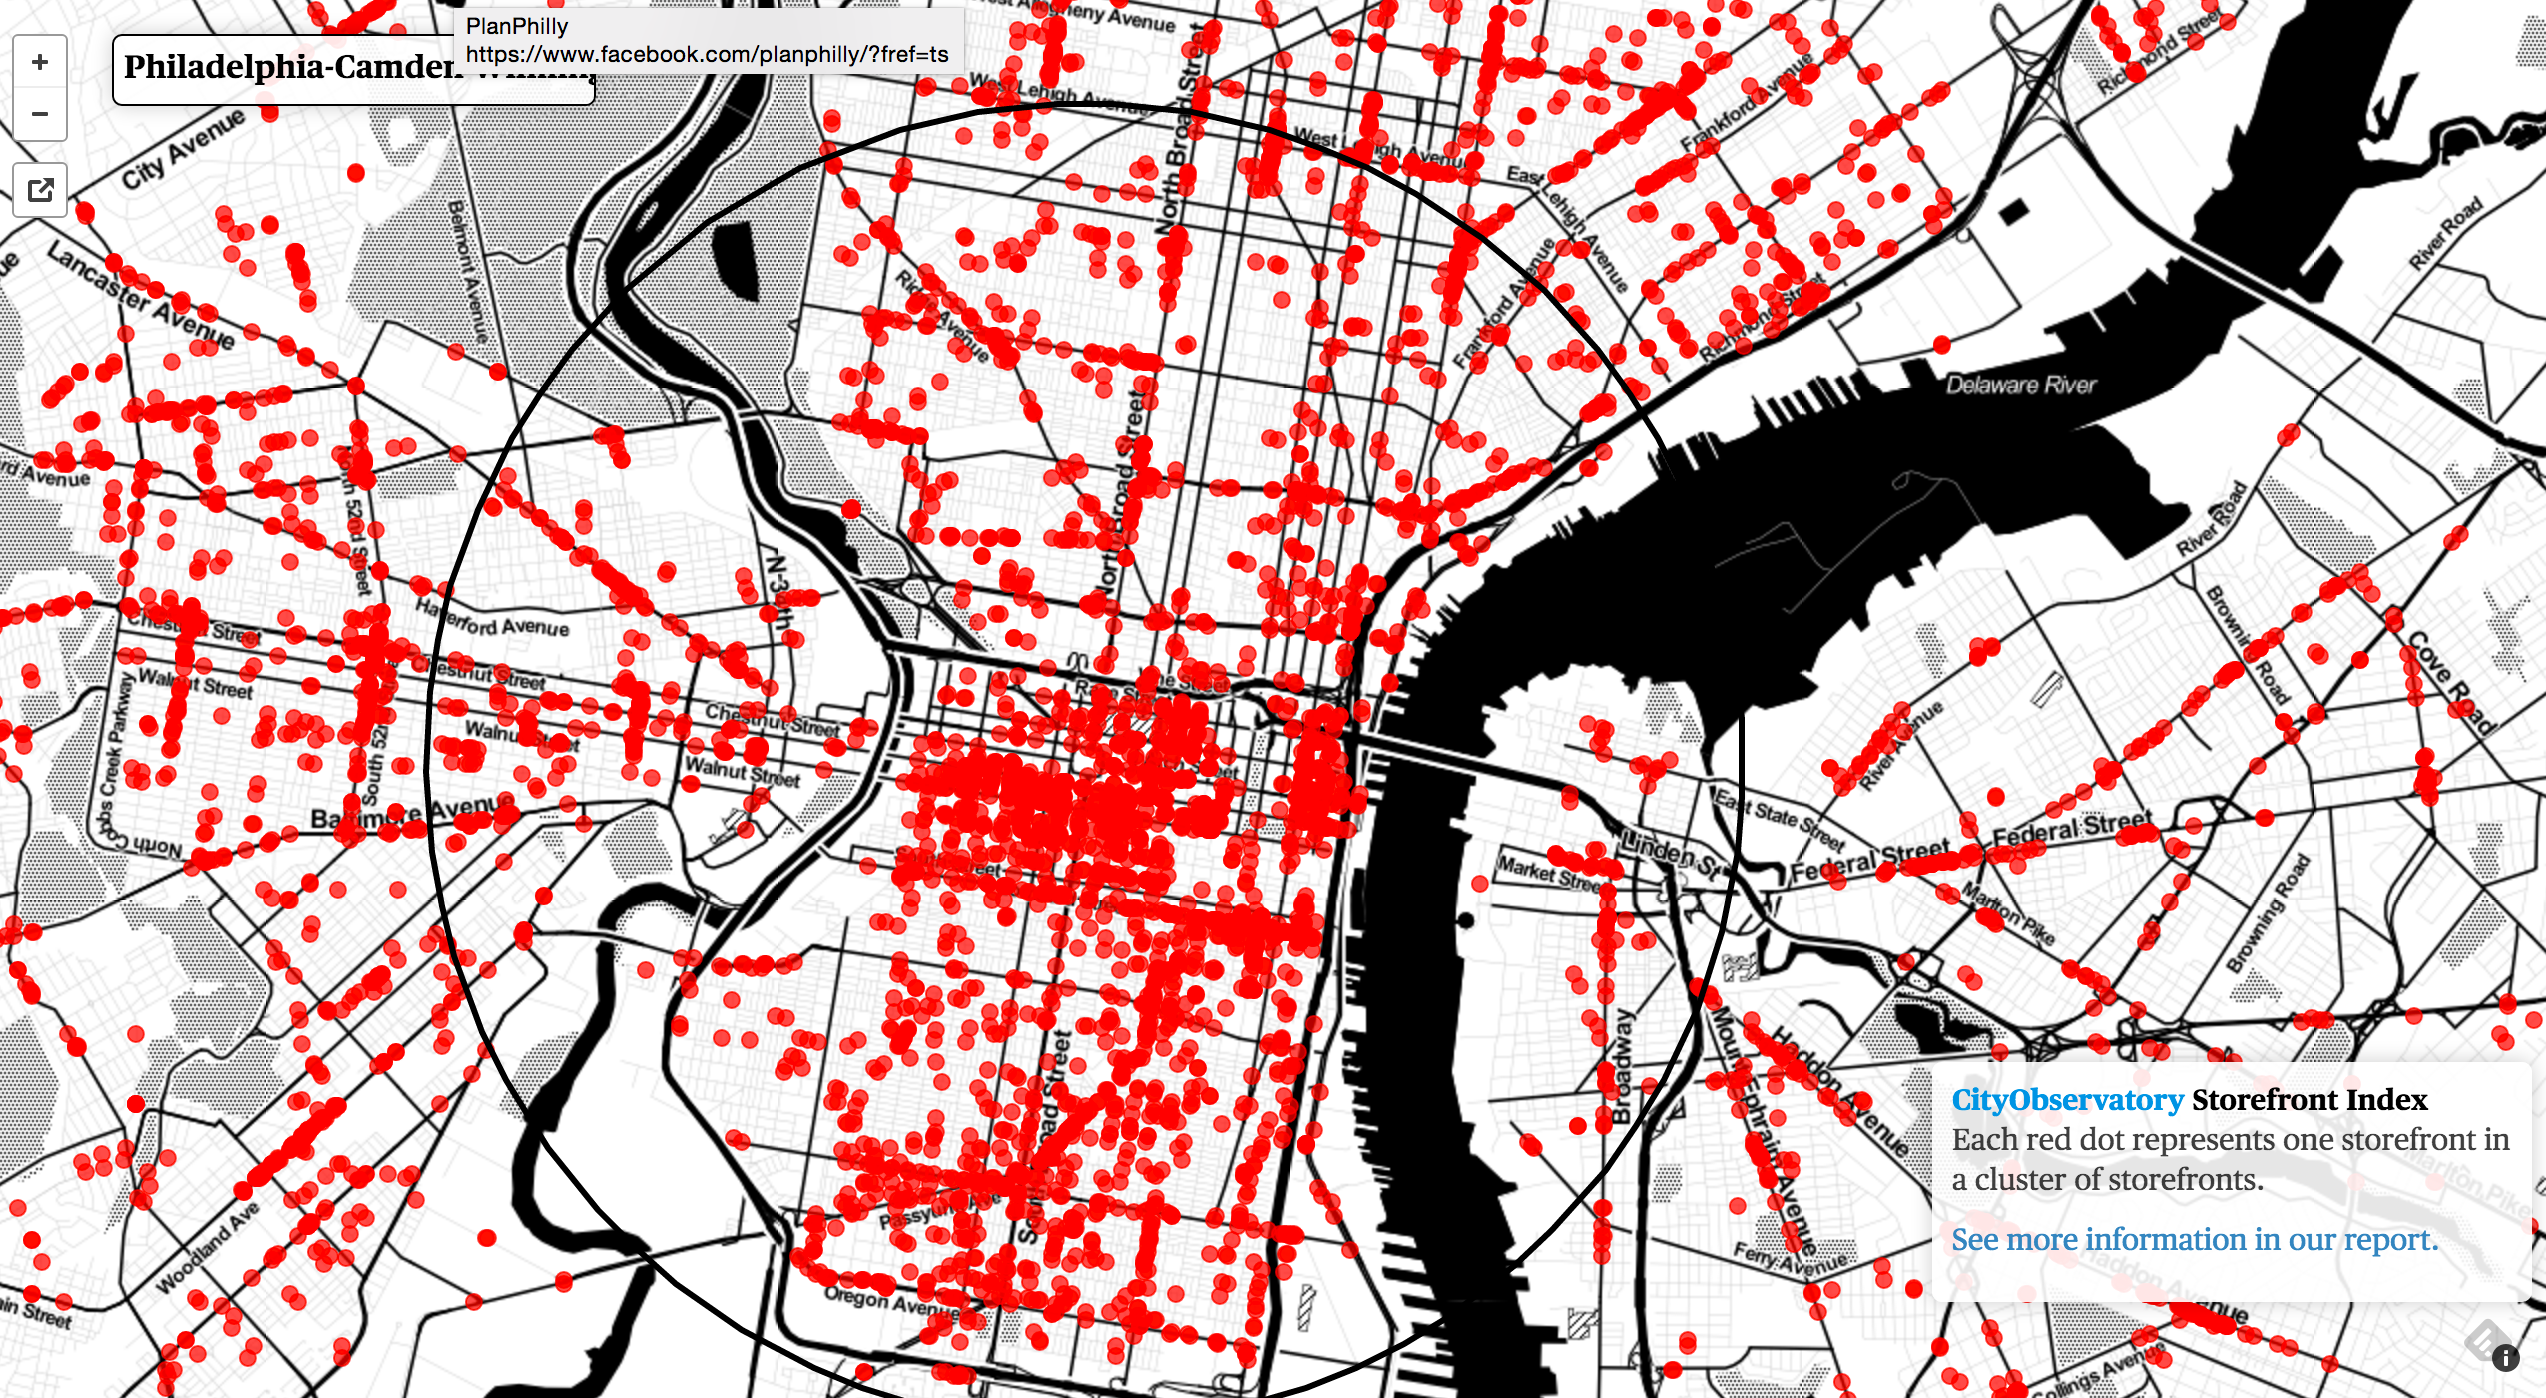
To put Philadelphia in context, out of the 51 largest metros, the city had the fourth highest number (3,084) of storefront businesses within three miles of our central business district in 2014. The median metropolitan area on the list (Pittsburgh, coincidentally) had around 900 storefront businesses within that radius.
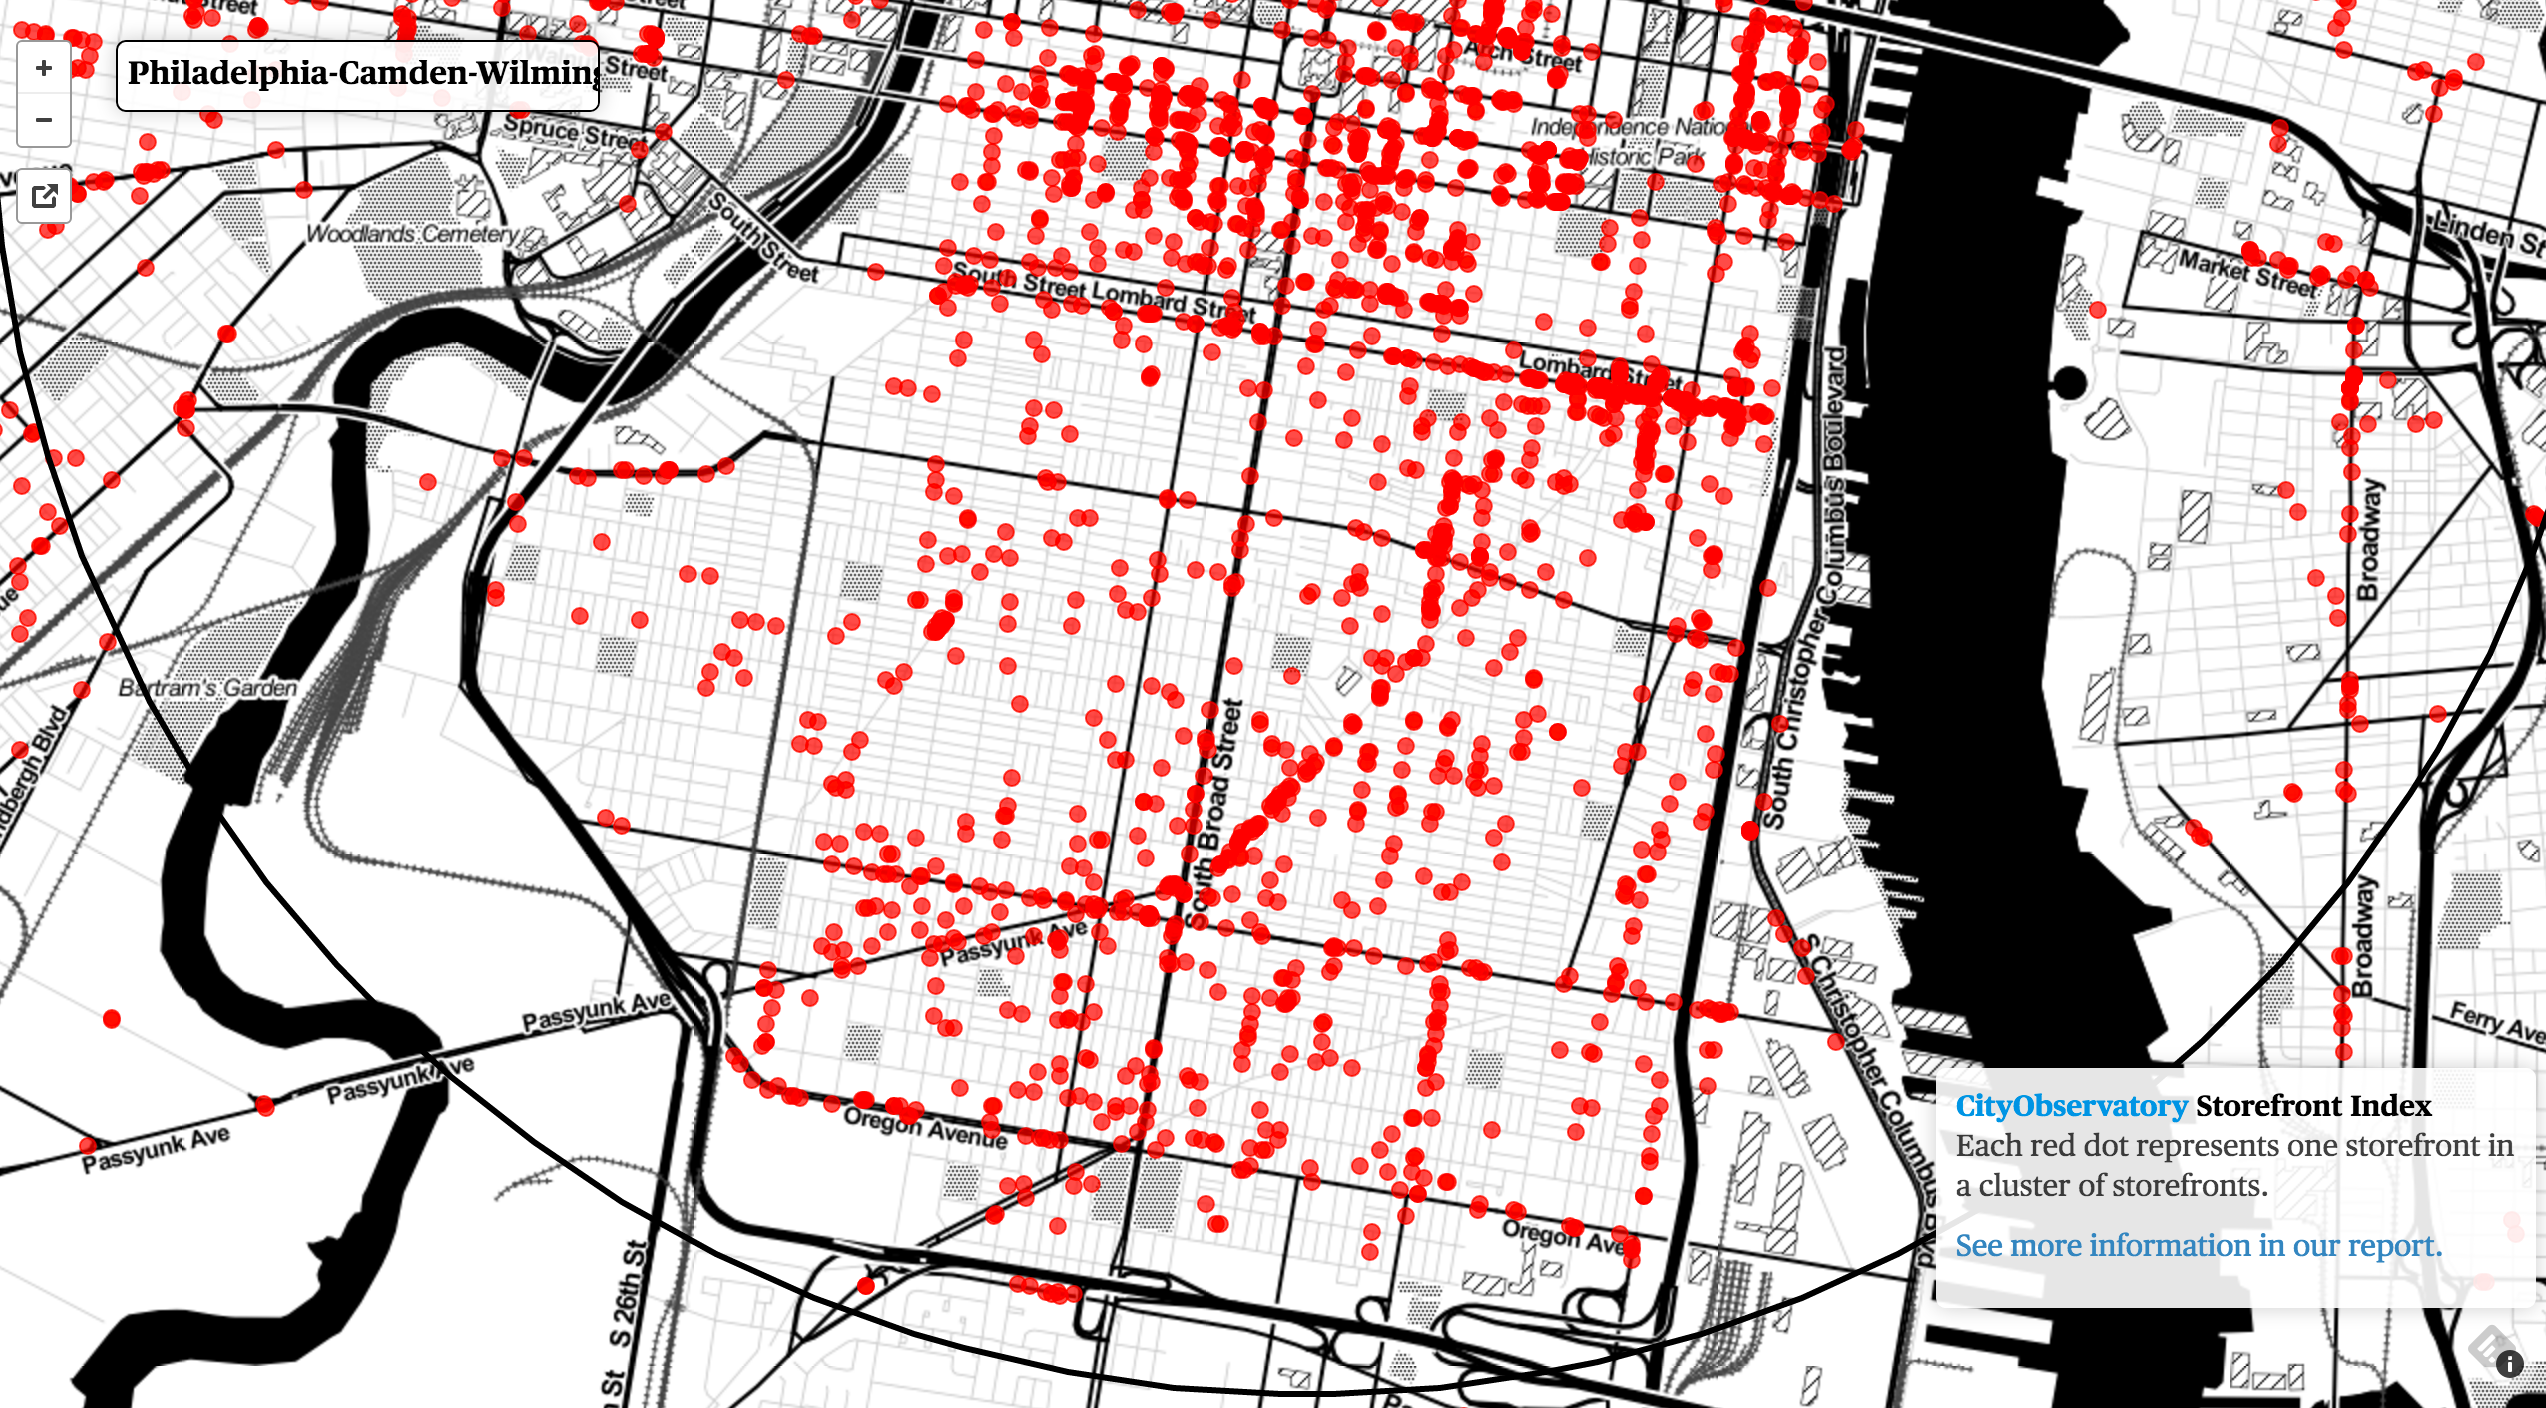
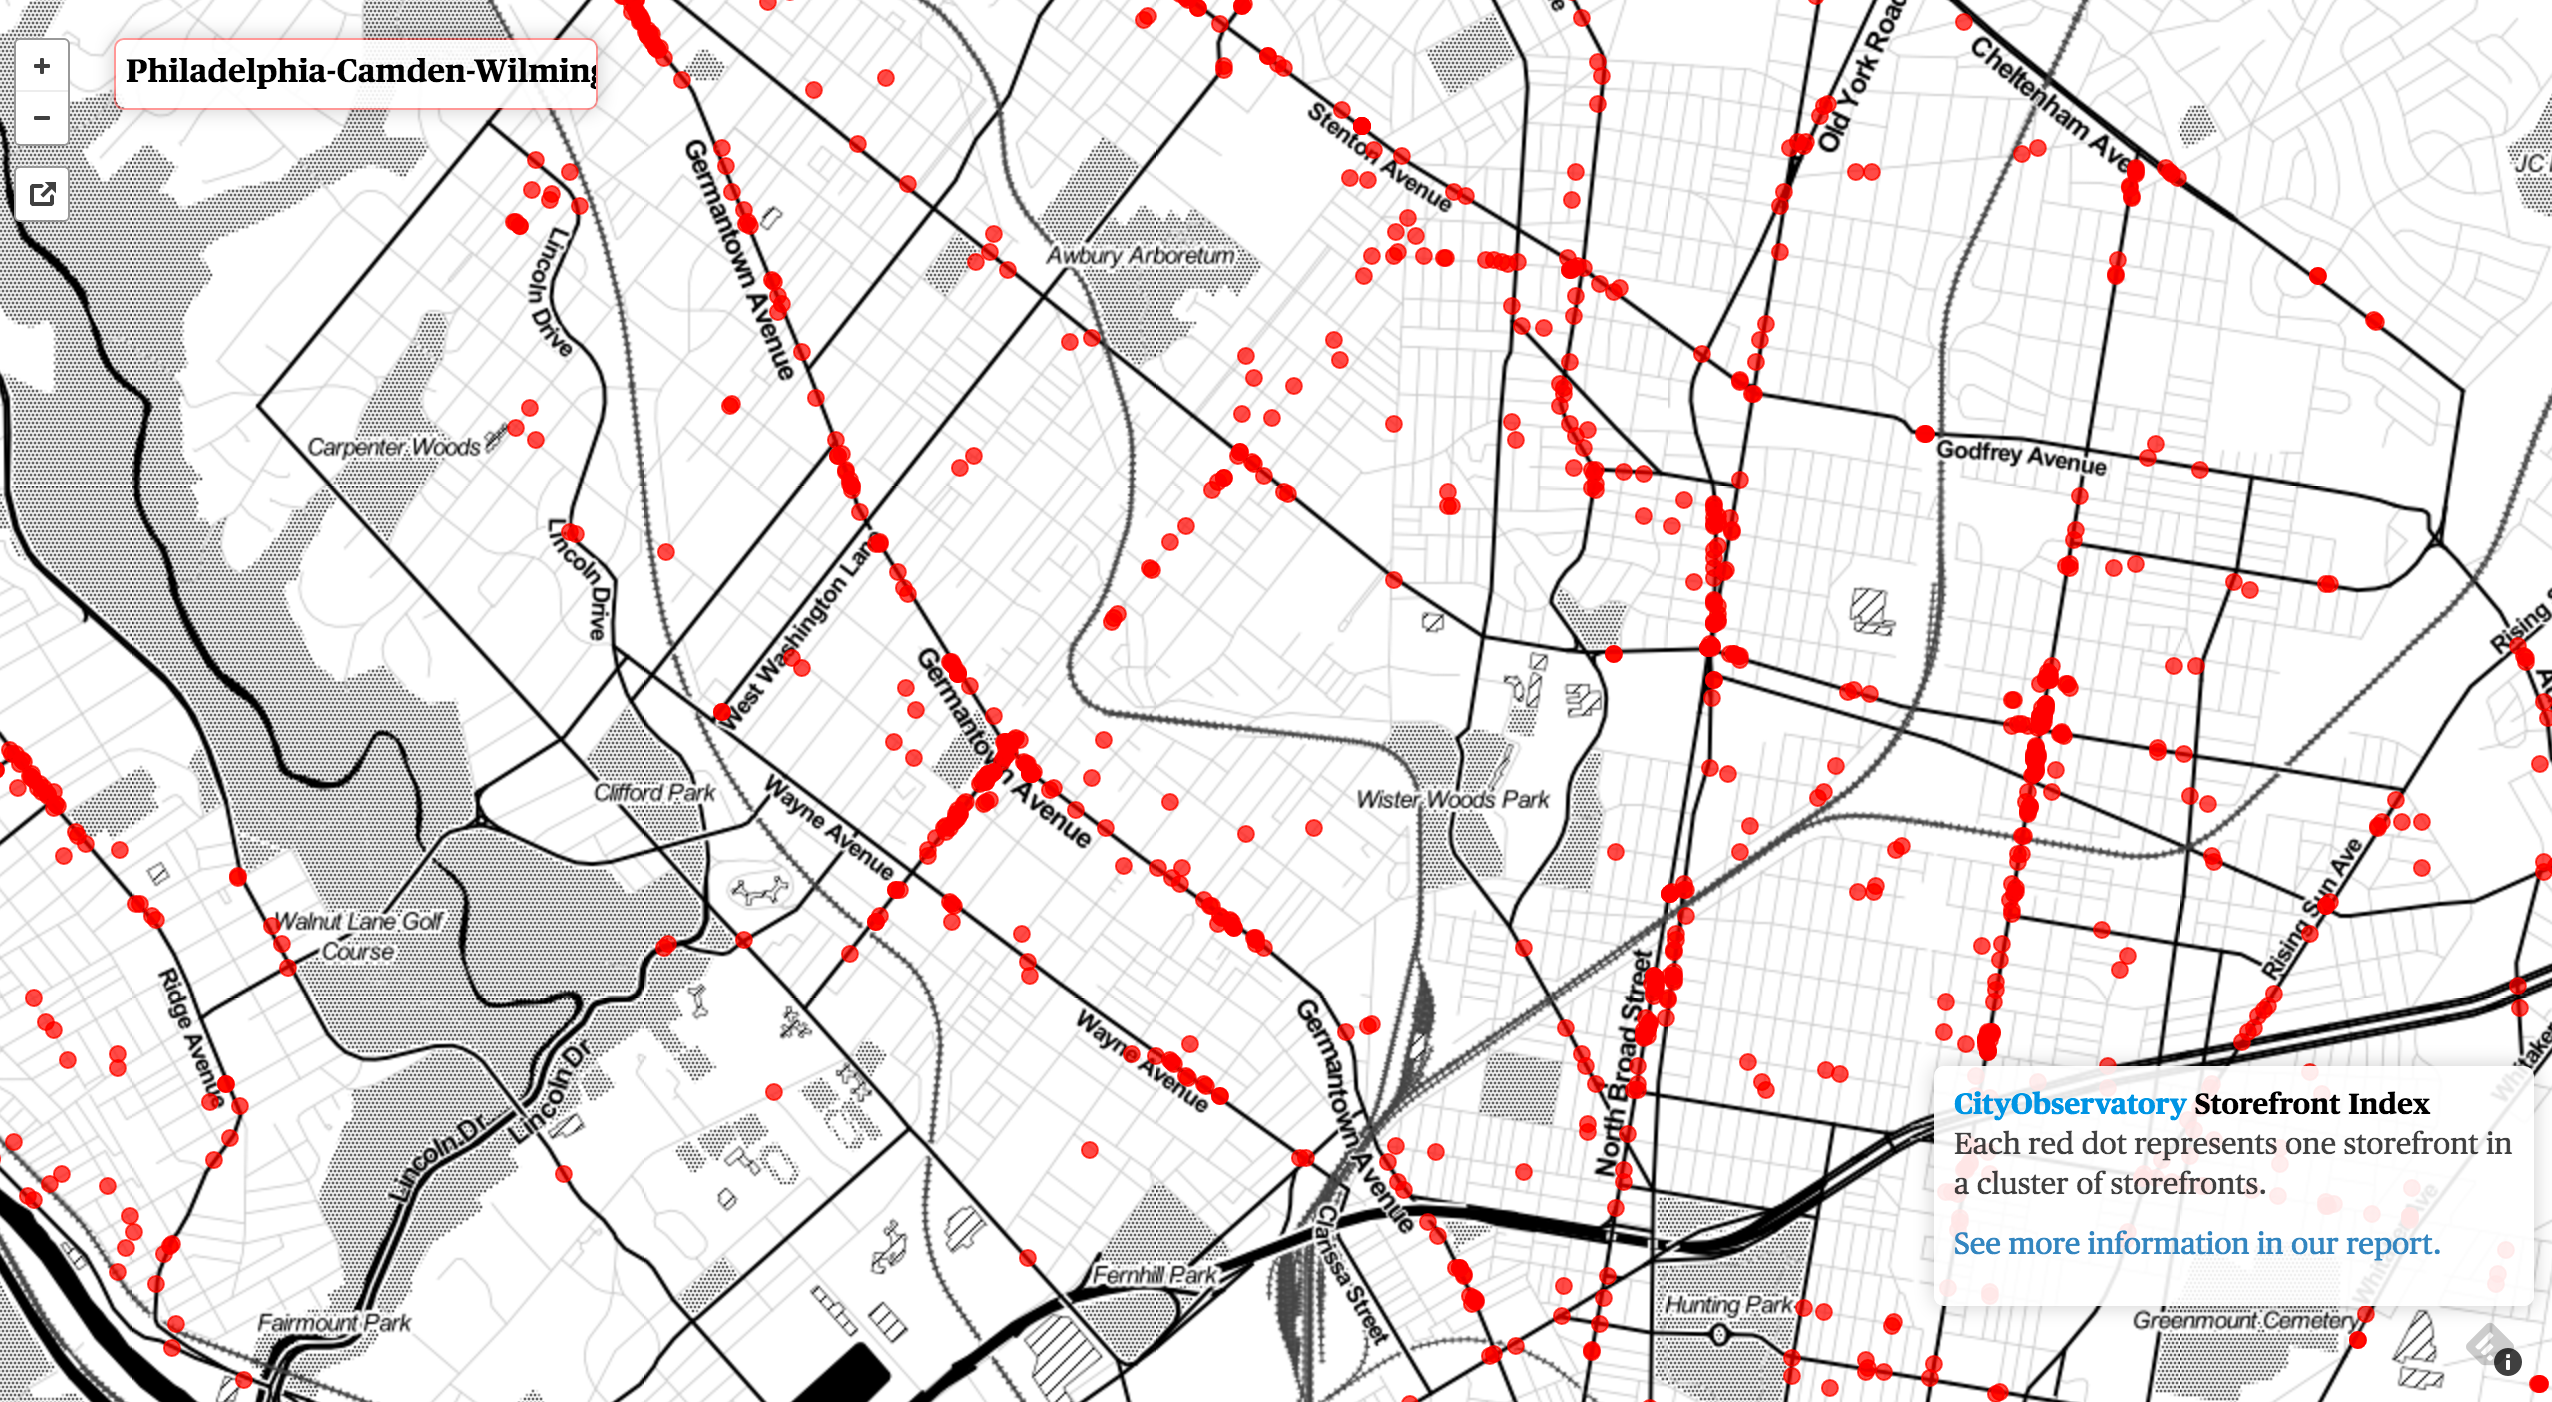
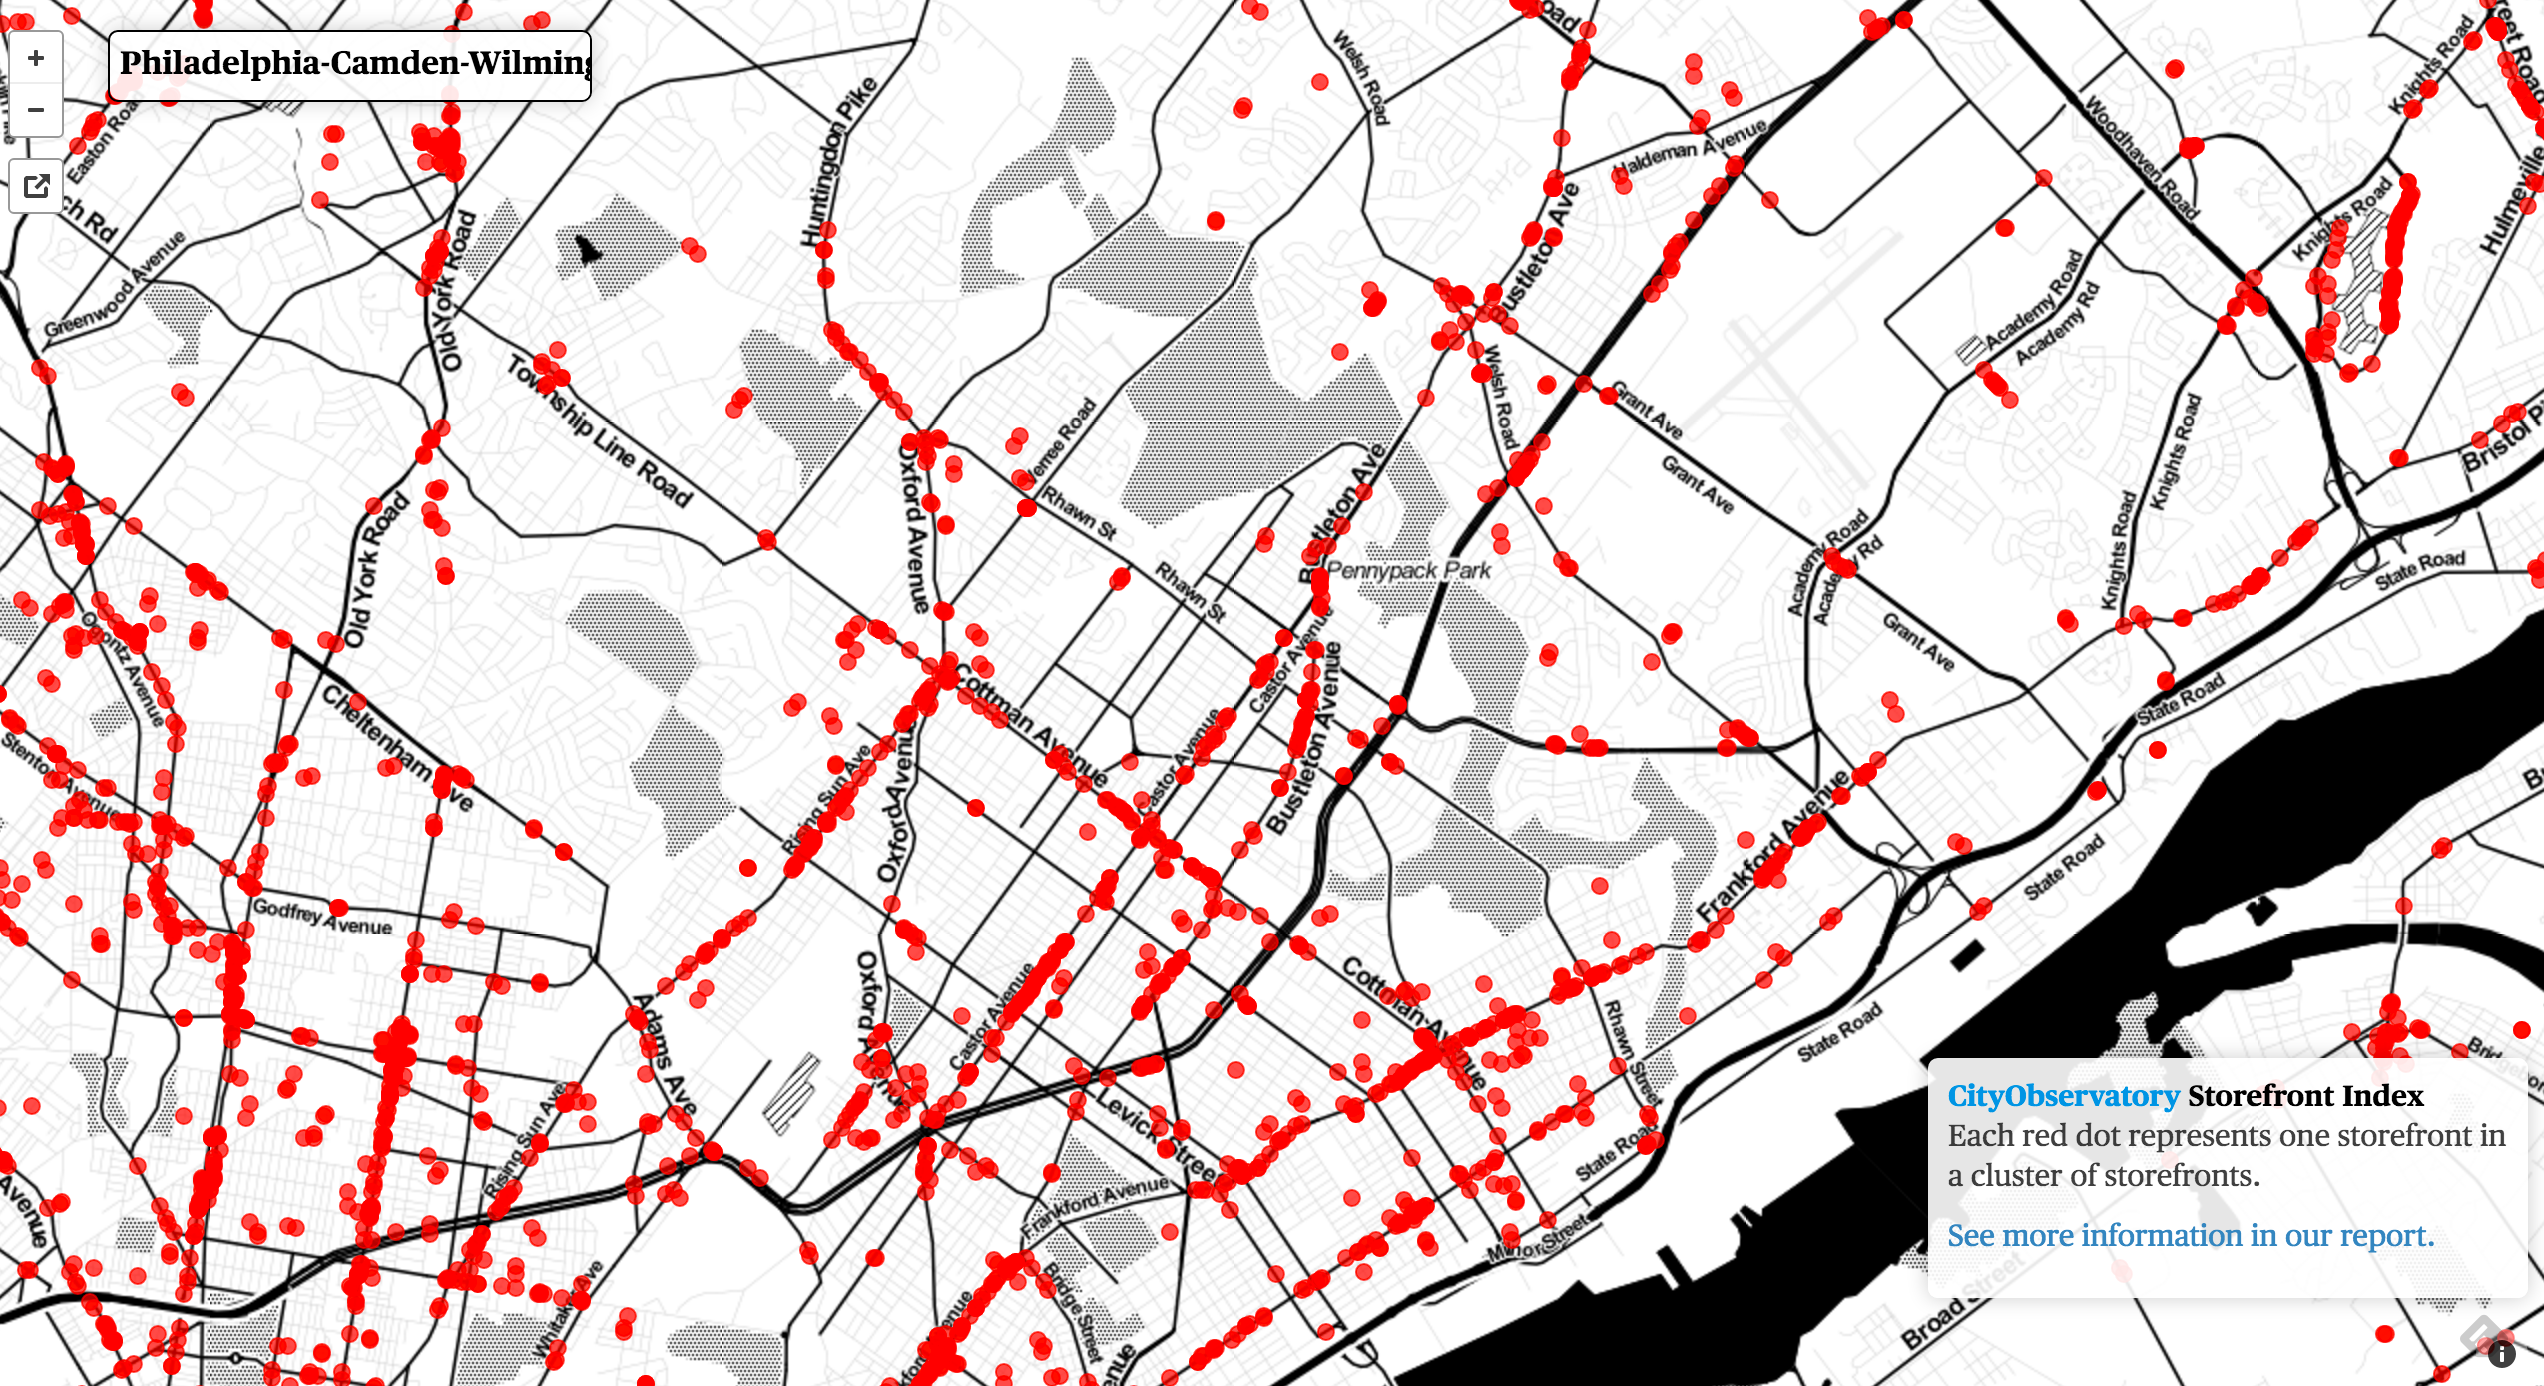
As the map shows, though, neighborhood storefront clusters outside of Center City don’t come close to matching the intensity of the central business district, and there’s a question of just how much storefront density a neighborhood corridor needs to be successful.
The report doesn’t offer a specific prescription on this point, but it does show that business districts in some smaller cities can get by with a much lower concentration of storefronts than is typical around center city Philadelphia.
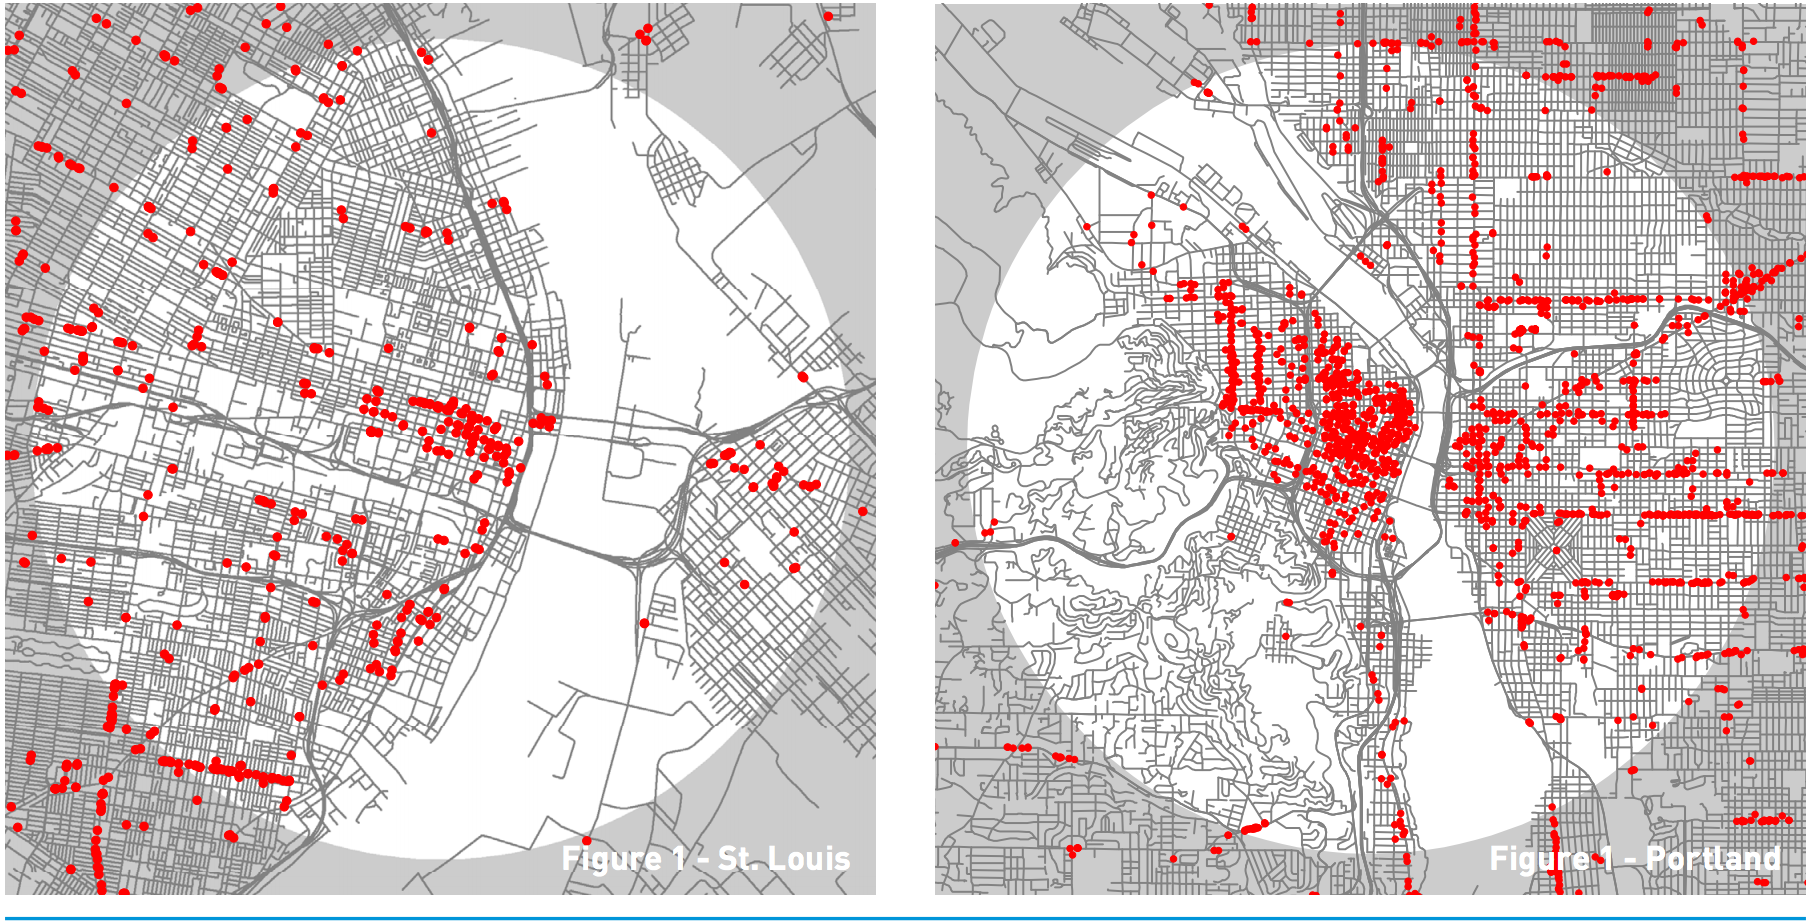
The three-mile area around downtown St. Louis, for instance, has only around 400 storefronts, compared to about 1,700 in Portland. St. Louis also has fewer and smaller minor commercial strips within that radius than Portland does. This is likely a function of higher residential density in Portland.
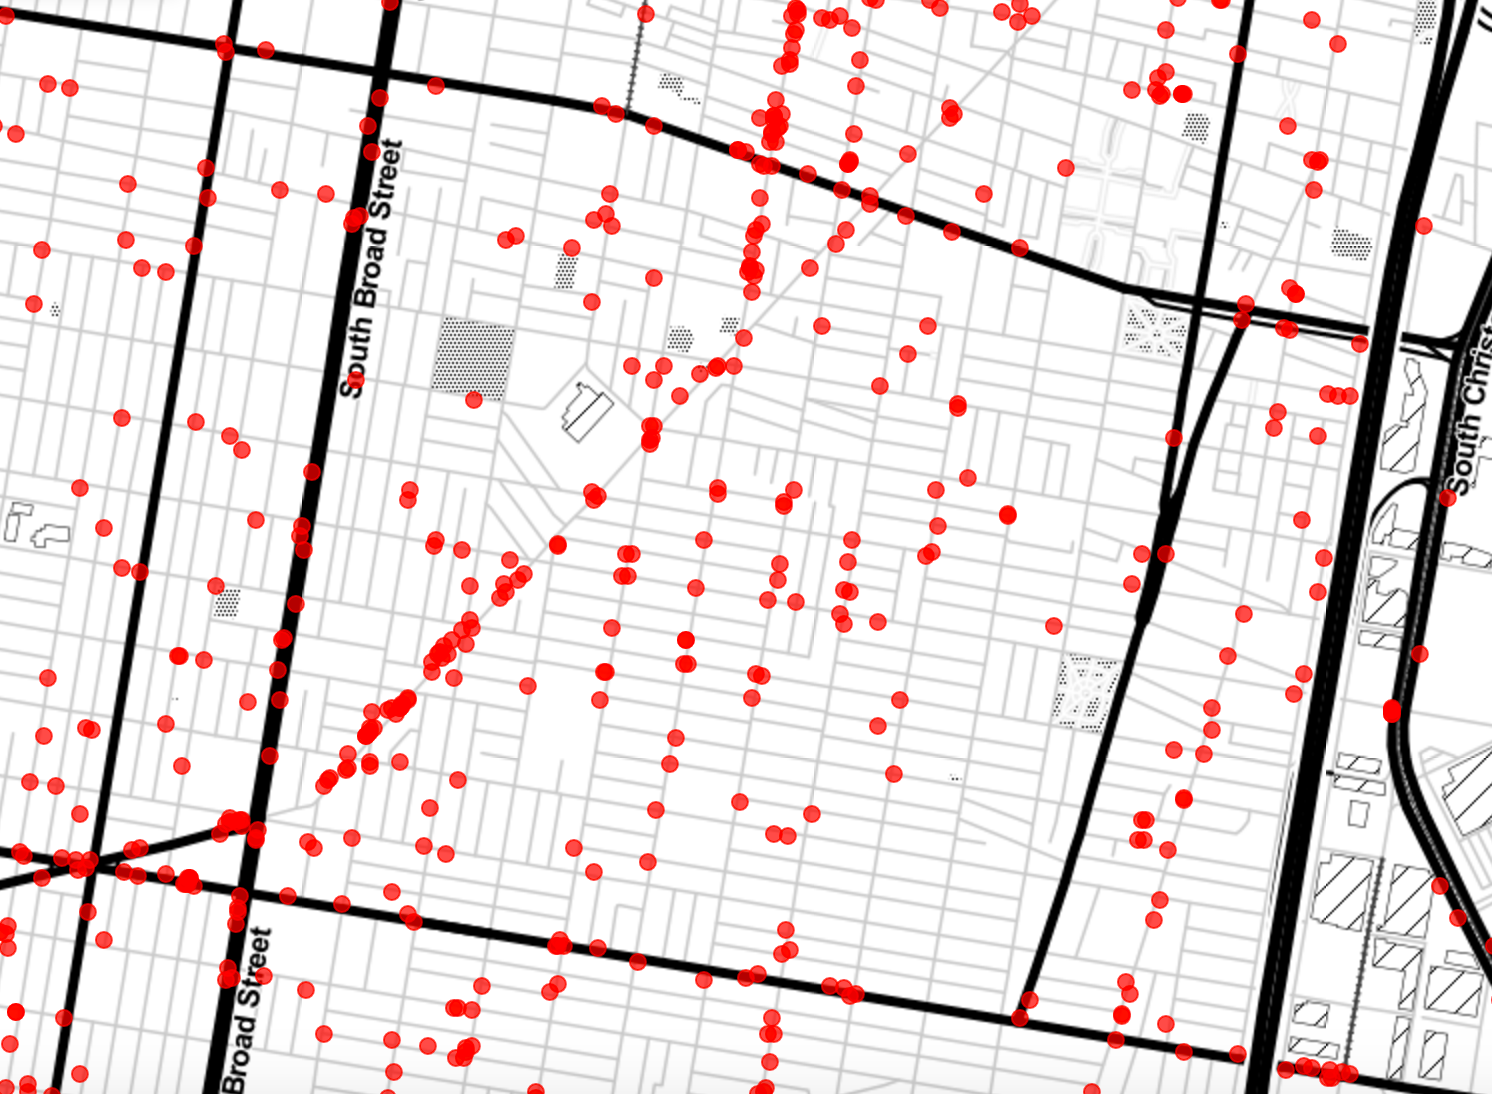
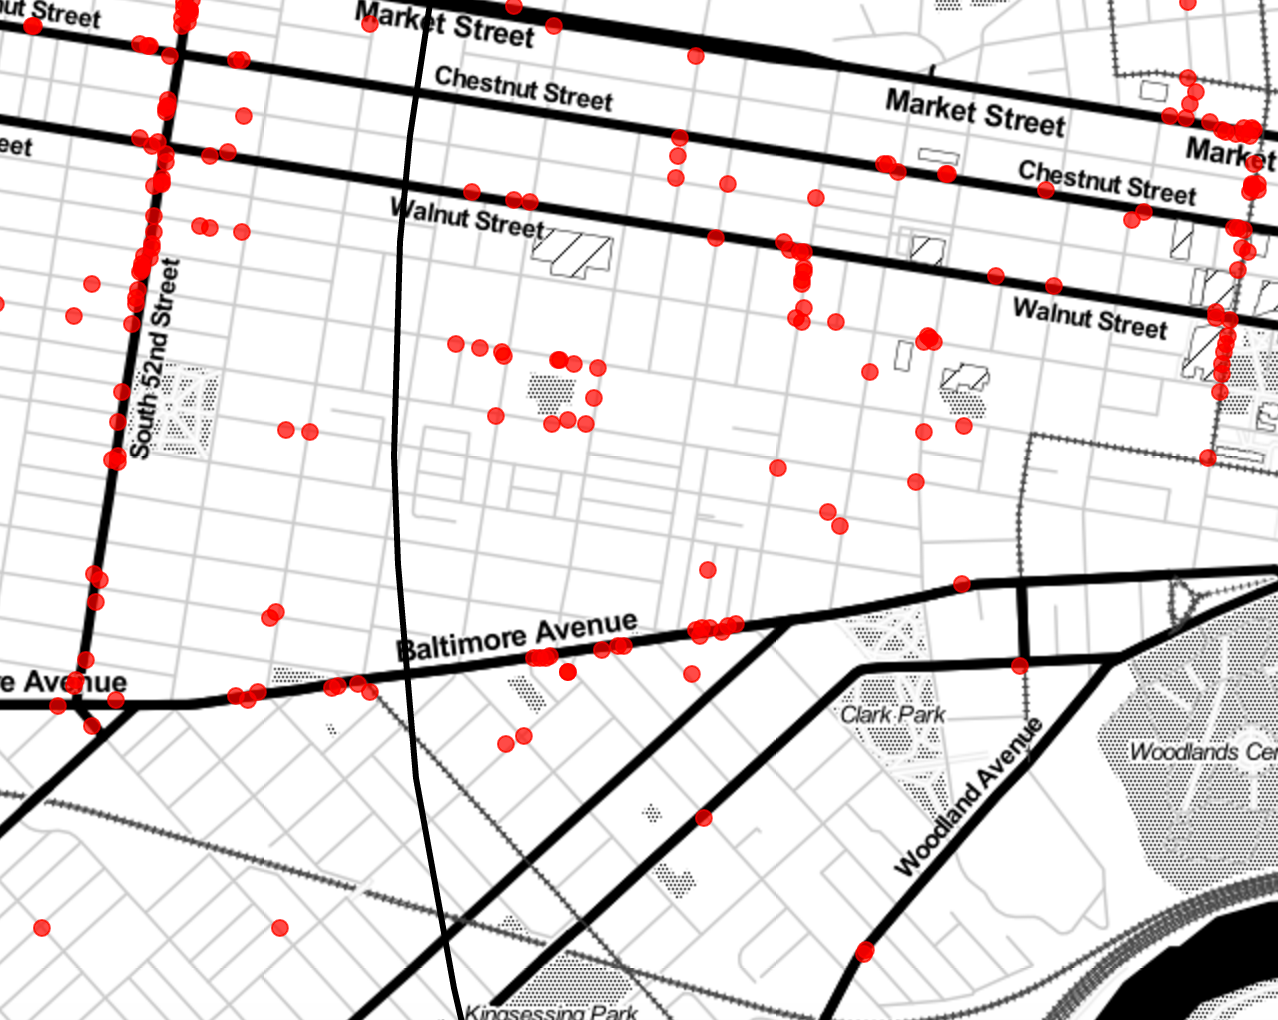
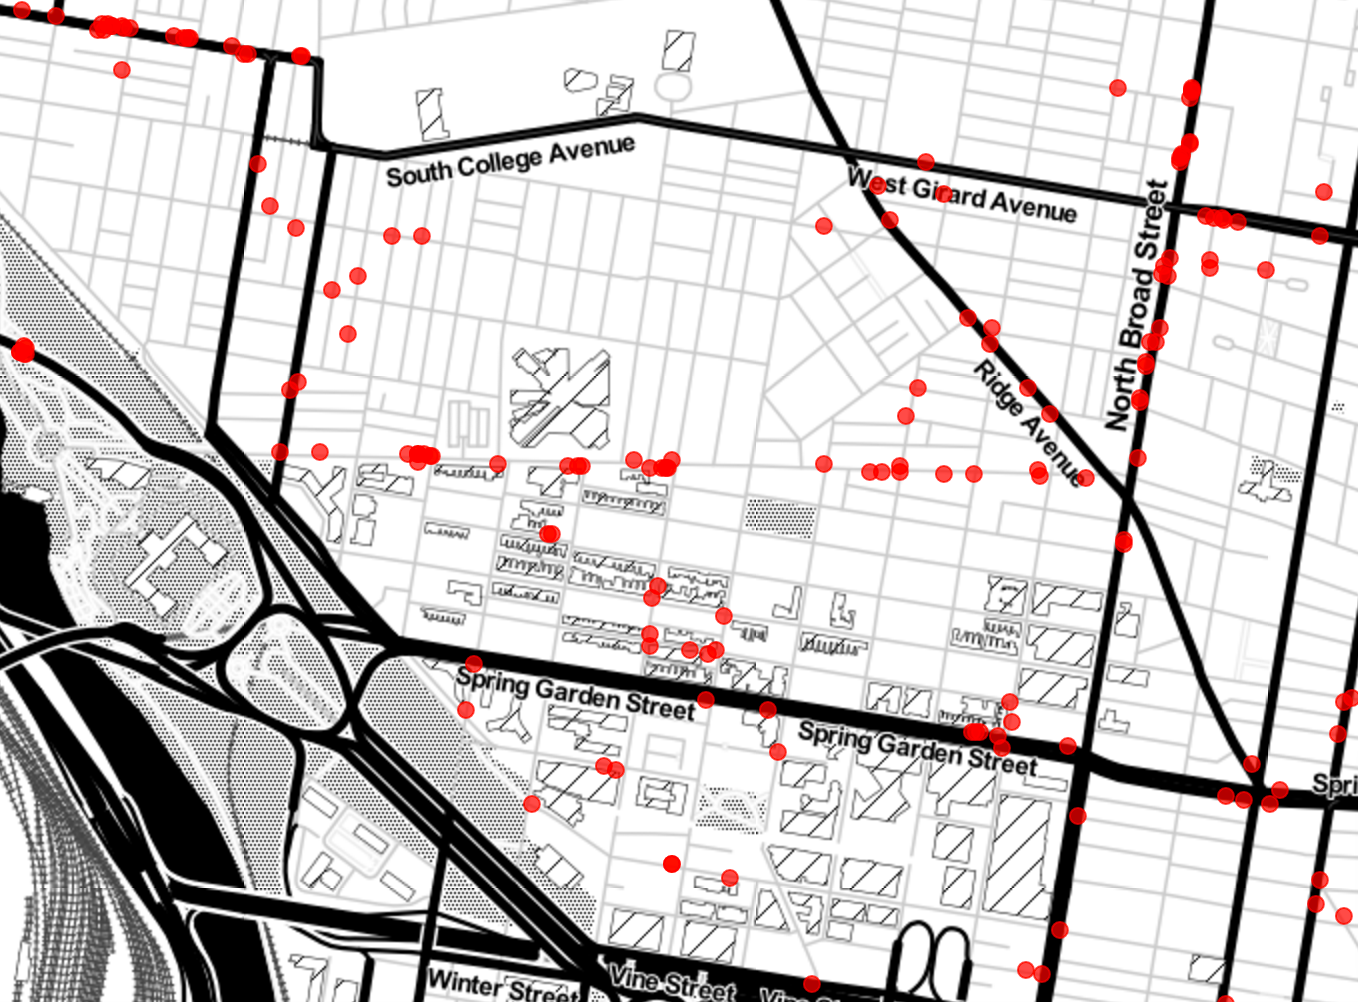
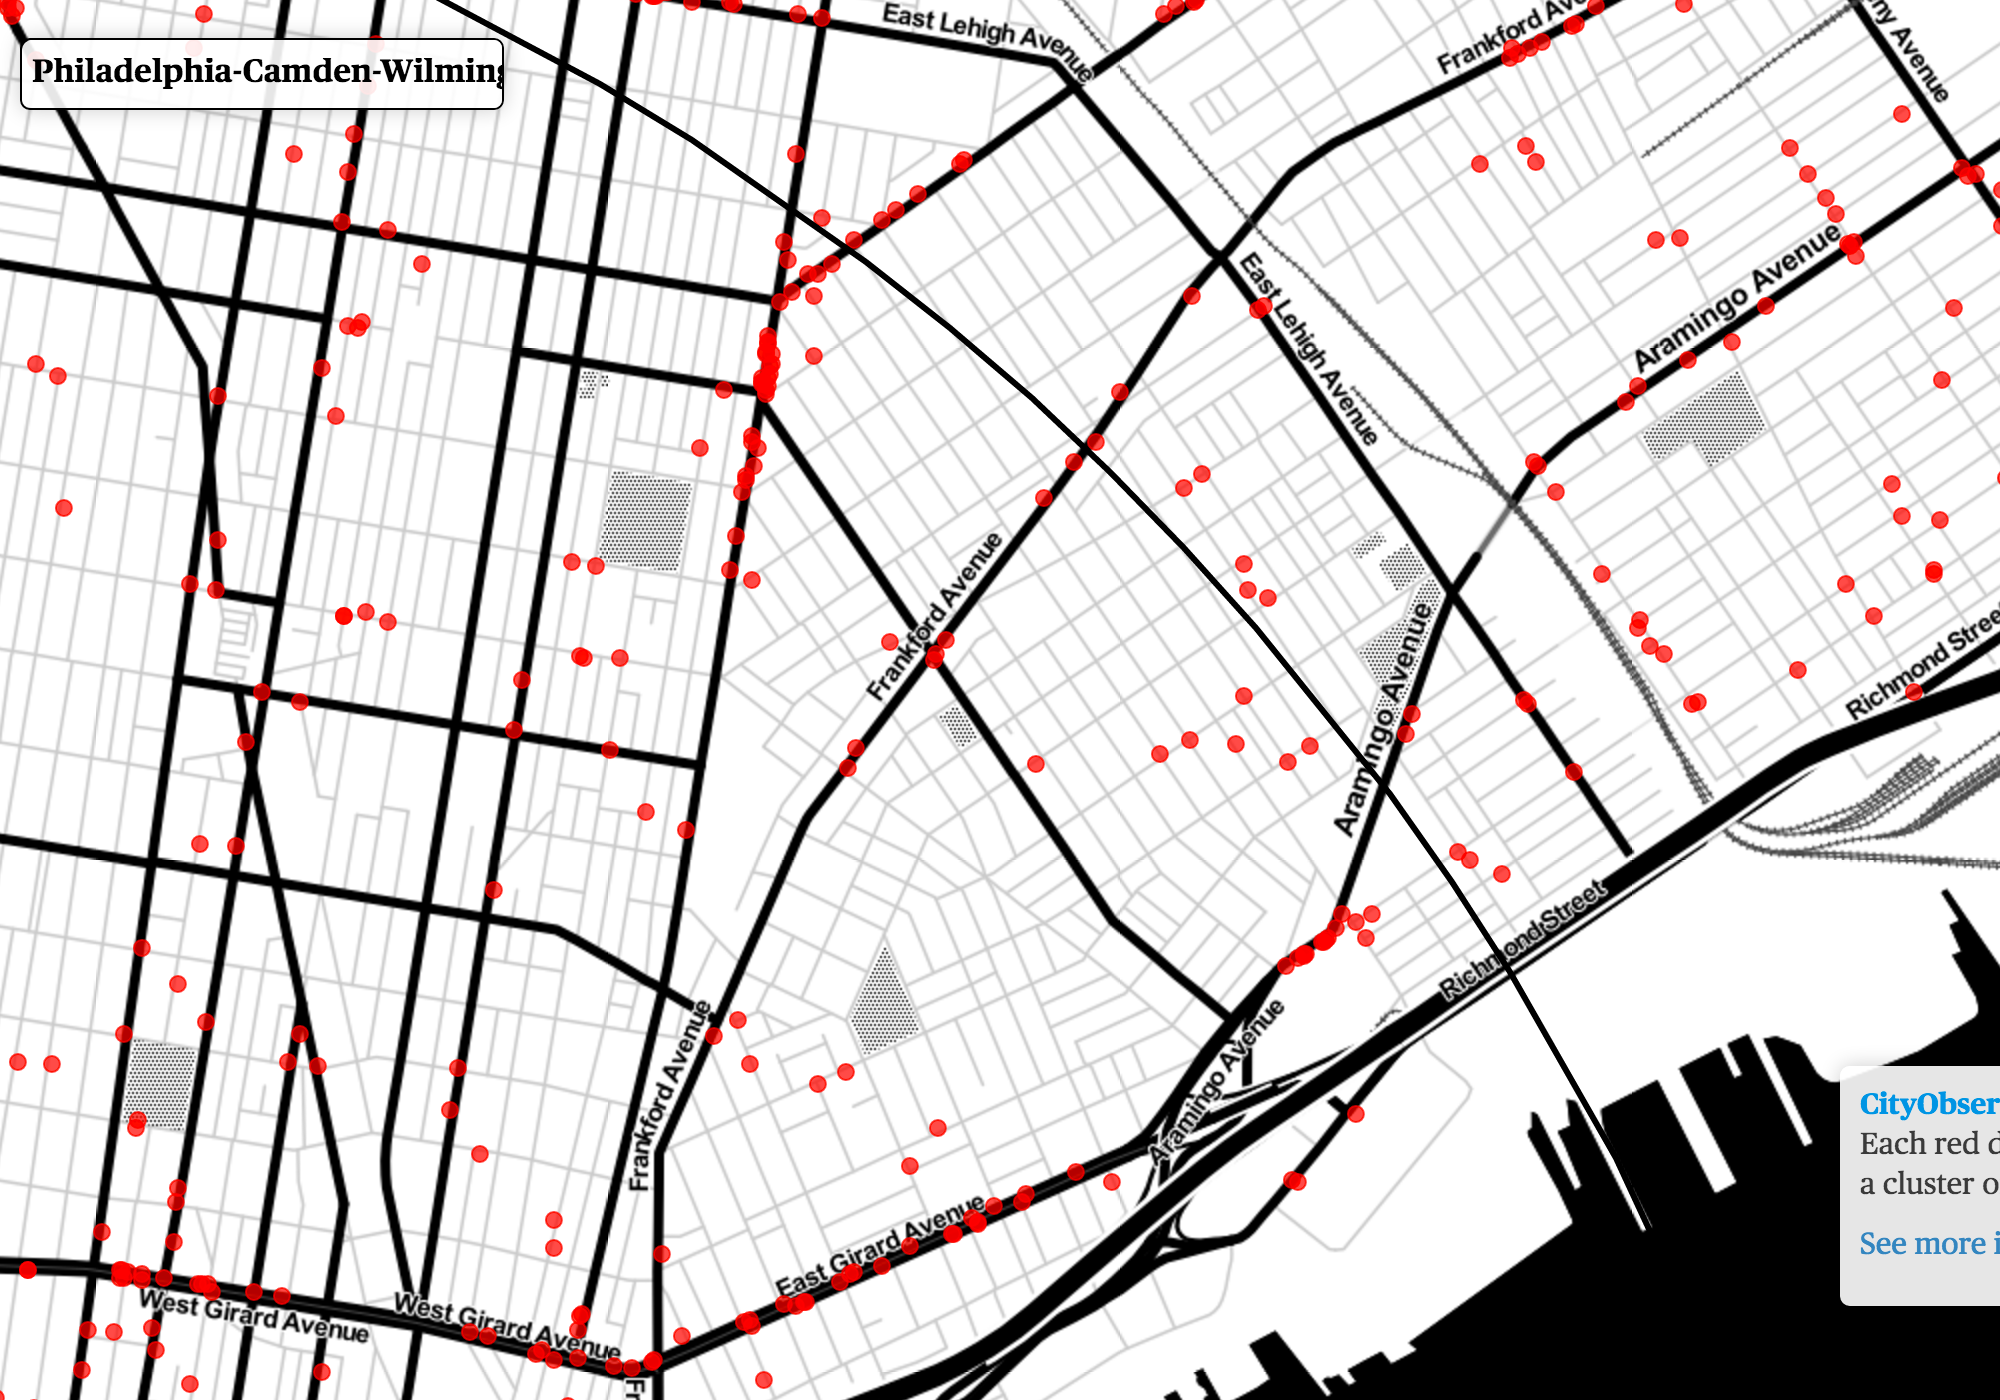
Here in Philadelphia, we see a range of storefront densities on commercial corridors. You can see the difference in concentrations on E. Passyunk Avenue, Baltimore Avenue, and Fairmount Avenue:
At present, the amount of land zoned for mixed uses represents only a small fraction of Philadelphia’s total land area—about 9 percent of properties, covering around 7.4 percent of zoned land area. By contrast, single-use residential buildings make up 78 percent of properties, or half the city’s land area.
Most neighborhoods appear to have at least one business cluster, illustrating the appeal of commercial corridors as a focal point for Kenney’s more neighborhood-focused economic development initiatives.
The API that City Observatory released with the report could prove helpful for visualizing the concentration of storefronts in conjunction with other measures of neighborhood livability like Walk Score, community assets, population density, and real estate prices.
The map also allows users to compare storefront densities across different neighborhoods, both locally and between cities.
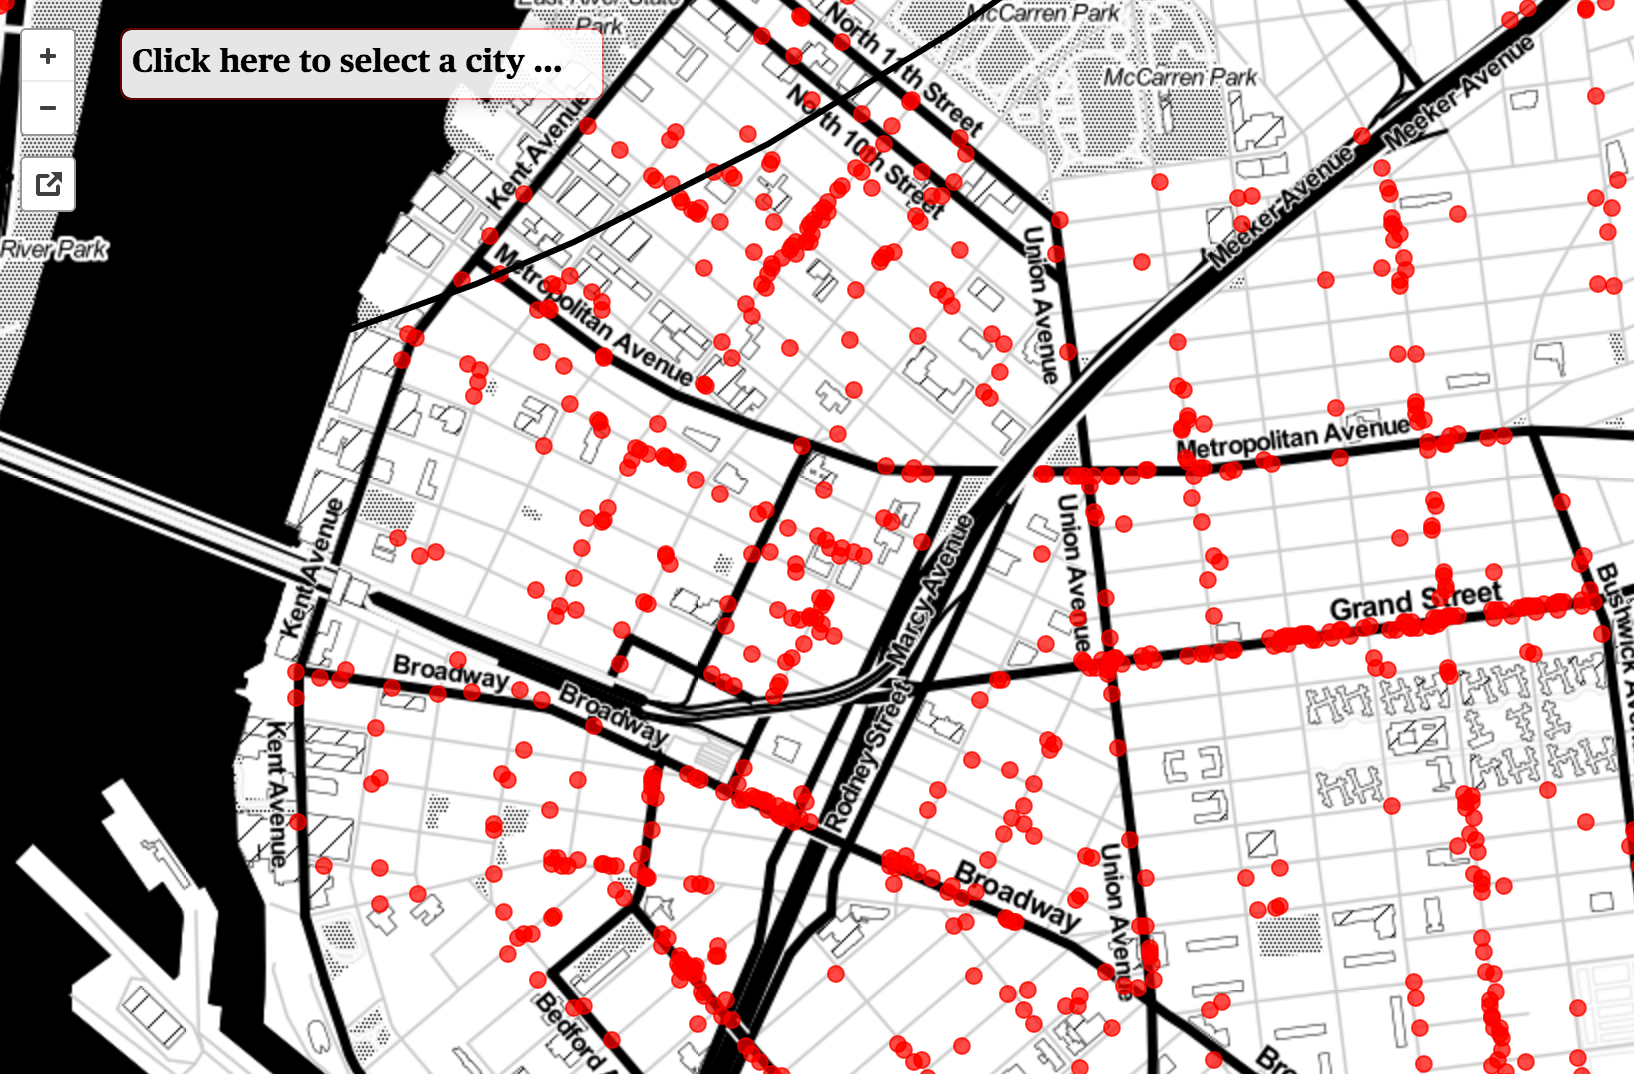
For example, every now and then people will say that Fishtown—for good or for ill—is becoming the next Williamsburg (Brooklyn’s notorious hipster neighborhood) based on the growing concentration of trendy neighborhood shops, eateries, and bars.
And while it’s true that Fishtown has experienced a lot of change in recent times, a direct comparison of the storefront intensity in the two neighborhoods reveals that Fishtown is still quite a long way off from experiencing anything like the concentration of neighborhood business activity in Williamsburg. These kinds of comparisons can be helpful for establishing more realistic benchmarking, and provide a measure of context for neighborhood change.
Read the report, explore the map, and share your observations in the comments.
WHYY is your source for fact-based, in-depth journalism and information. As a nonprofit organization, we rely on financial support from readers like you. Please give today.
