

Why Trump could have a harder time winning Pennsylvania in 2020


President Donald Trump speaks during a news conference in the East Room at the White House in Washington, Wednesday, Nov. 7, 2018. (Manuel Balce Ceneta/AP Photo)
Should President Trump worry about the results in Pennsylvania’s congressional races last week?
Yes.
Trump’s narrow and surprising win in Pennsylvania two years ago was key to his victory in the Electoral College, and he’ll want to win the state again in 2020.
His problem is not just that Democrats picked up congressional seats – that was likely to happen after the Pennsylvania Supreme Court drew new, more Democrat-friendly districts.
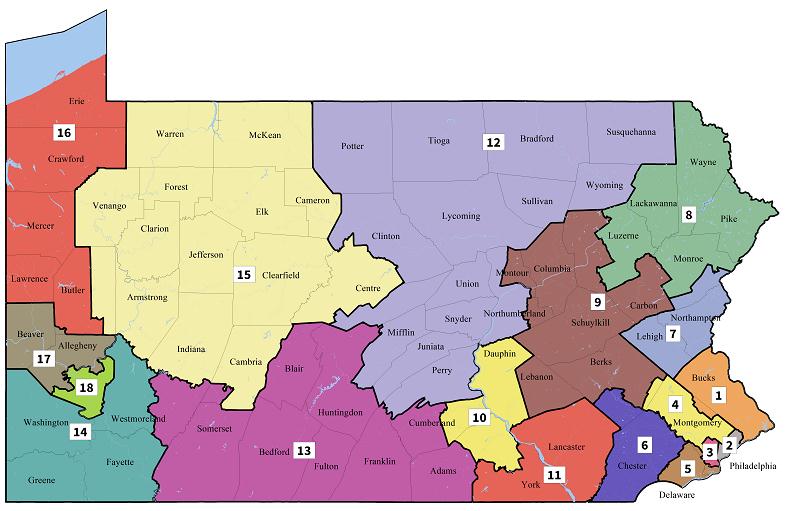
But even if you compare winning Republican congressional candidates’ margins last week to Trump’s margins in those same geographic boundaries two years ago (see chart below), the contrast is striking.
Take the 16th Congressional District in far western Pennsylvania.
Voters there went for Trump by 20 points in 2016. Incumbent Republican Congressman Mike Kelly held off Democratic challenger Ron DiNicola last week by just four points.
Dickinson College political scientist Sarah Niebler said that wasn’t an exception.
“It’s significant for Trump, mostly in the fact that it’s across the board,” Niebler said in a phone interview. “The shift was not just concentrated in urban areas or in rural areas, but it was in the entire state.”
Republican Congressional candidates last week trailed Trump’s 2016 margins in 17 of the state’s 18 congressional districts by an average of more than eight points.
This, of course, is after polls, pundits, and the president himself described the election as a referendum on Trump’s presidency.
Statewide, there were 474,000 more votes cast for Democrats than Republican congressional candidates – a margin somewhat inflated by the fact that the GOP failed to run a candidate in the 18th District in Pittsburgh, netting it no votes in an area where Trump won a third of the votes in 2016.
The one Republican candidate who beat Trump’s performance in his district was Rep. Brian Fitzpatrick in the 1st District in Bucks County.
Another take
Jason Gottesman, communications director for the Pennsylvania Republican Party, acknowledged that Democrats had performed well last week, but noted that Republicans held onto several contested seats, including Fitzpatrick’s and Kelly’s.
“2020 will present a whole different landscape,” Gottesman said. “We don’t know if there will be the same level of Democratic enthusiasm, and the president himself will be on the ballot, which adds an X-factor.”
Franklin and Marshall College political scientist Terry Madonna agreed that the results are meaningful, but not predictive.
“Right now, you’d have to say President Trump is going to have a difficult time carrying the state,” Madonna said. “But we’re still a long way off and we still have no clue who the Democratic nominee is going to be. We have no clue what the president’s job performance will be. Game on, as they say.”
Trump 2016 margins vs. GOP Congressional Candidates margins, 2018
| District/Candidate | Trump Margin 2016 | GOP Congressional Margin 2018 | Difference |
| PA-01 Brian Fitzpatrick | -2 | 2.6 | 4.6 |
| PA-02 David Torres | -48 | -58 | -10.0 |
| PA-03 Bryan Leib | -83.9 | -86.8 | -2.9 |
| PA-04 Dan David | -19.3 | -26.8 | -7.5 |
| PA-05 Pearl Kim | -28.2 | -30.2 | -2.0 |
| PA-06 Greg McCauley | -9.3 | -17.6 | -8.3 |
| PA-07 Marty Nothstein | -1.1 | -9.8 | -8.7 |
| PA-08 John Chrin | 9.6 | -9.2 | -18.8 |
| PA-09 Dan Meuser | 34 | 19.8 | -14.2 |
| PA-10 Scott Perry | 8.9 | 2.8 | -6.1 |
| PA-11 LLoyd Smucker | 25.8 | 17.2 | -8.6 |
| PA-12 Tom Marino | 36.4 | 32.2 | -4.2 |
| PA-13 John Joyce | 45.7 | 40.8 | -4.9 |
| PA-14 Guy Reschenthaler | 29 | 16 | -13.0 |
| PA-15 Glenn Thompson | 43.3 | 35.8 | -7.5 |
| PA-16 Mike Kelly | 20 | 4.1 | -15.9 |
| PA-17 Keith Rothfus | 2.6 | -12.4 | -15.0 |
| PA-18 No candidate | -27.5 | 0 | 27.5 |
| Average Difference (excluding 18) – 8.4 |
| *Sources: Daily Kos calculations for 2016 presidential results/ Pa. Dept. of State unofficial returns for 2018 Cong. results |
WHYY is your source for fact-based, in-depth journalism and information. As a nonprofit organization, we rely on financial support from readers like you. Please give today.
Brought to you by Dave Davies: Off Mic

Independents who want to vote in Pennsylvania’s closed primaries seek help from state’s high court
“Exclusion from primary elections is the functional equivalent of losing the right to vote in those districts,” independent voters argued in a 51-page petition.
12 months ago

N.J. and Pa. among best-represented states on Election Day, according to report
The states are among the top 10 that reflect the voter population of their electorates based on race, age and gender, says a report by the personal finance site WalletHub.
2 years ago
Listen 1:08
Are Democrats losing Black voters in Pennsylvania?
While data from the 2020 and 2022 elections suggest that Black voters tend to vote Democratic, the Trump campaign is trying to gain momentum, especially among Black men.
Air Date: October 16, 2024 12:00 pm
Listen 46:07