


Maps: Pedestrian death rates are higher in poorer areas of Philadelphia

One interesting theme from City Council’s rollout of the CSI initiative was the recognition that some interest groups and constituents speak louder than others, which can distort Council members’ sense of what’s happening in their districts. So part of the impetus for CSI is a desire to re-balance the political conversation in favor of the common good.
Complete streets and other right-of-way issues are a good example of the lopsided lobbying problem that Council wants to resolve. Because when it comes time to divide up how the street space is allocated between pedestrians, bikes, cars, and buses, good policy doesn’t always make for good politics, especially when parking is concerned.
There, the political turf tends to be tilted in favor of the people who care the most and speak the loudest – generally wealthier, higher-status drivers – and the people who lobby the least – generally poorer, lower-status bus riders, cyclists, and pedestrians – see their interests fall by the wayside. Remember that time ward leader Carol Campbell held up the return of Rt. 15 trolley service for an entire extra year over a dozen illegal parking spaces?
Streets issues are also fraught with cultural politics and stereotypes that don’t always bear good relation to the data. There is a political sense that traffic-calming interventions like bike lanes and pedestrian plazas are straight out of Stuff White People Like, perhaps because white urbanists are the most vocal advocates for these policies on the Internet, and there has so far been very little political urgency for street safety and traffic calming interventions among Council members who represent Philly’s more economically-distressed neighborhoods.
But the data suggest representatives from distressed areas of the city should be paying more attention to this problem.
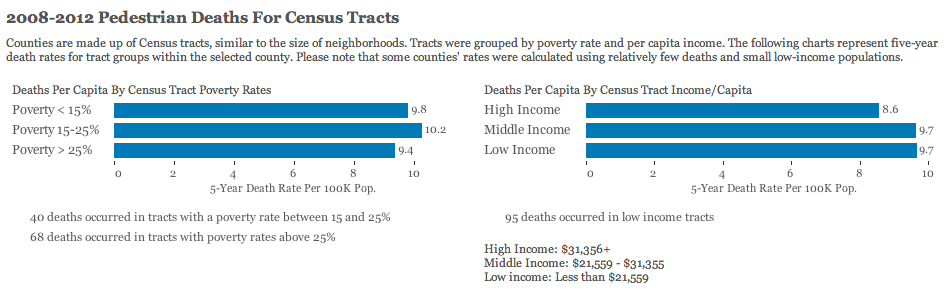
A new analysis from Governing magazine shows that Philadelphia’s low and middle income areas had higher rates of pedestrian deaths from car crashes than wealthier areas:
Here’s Daniel McGlone’s map of PennDOT data on pedestrian death locations over the same period (2008-2012) in Philadelphia:
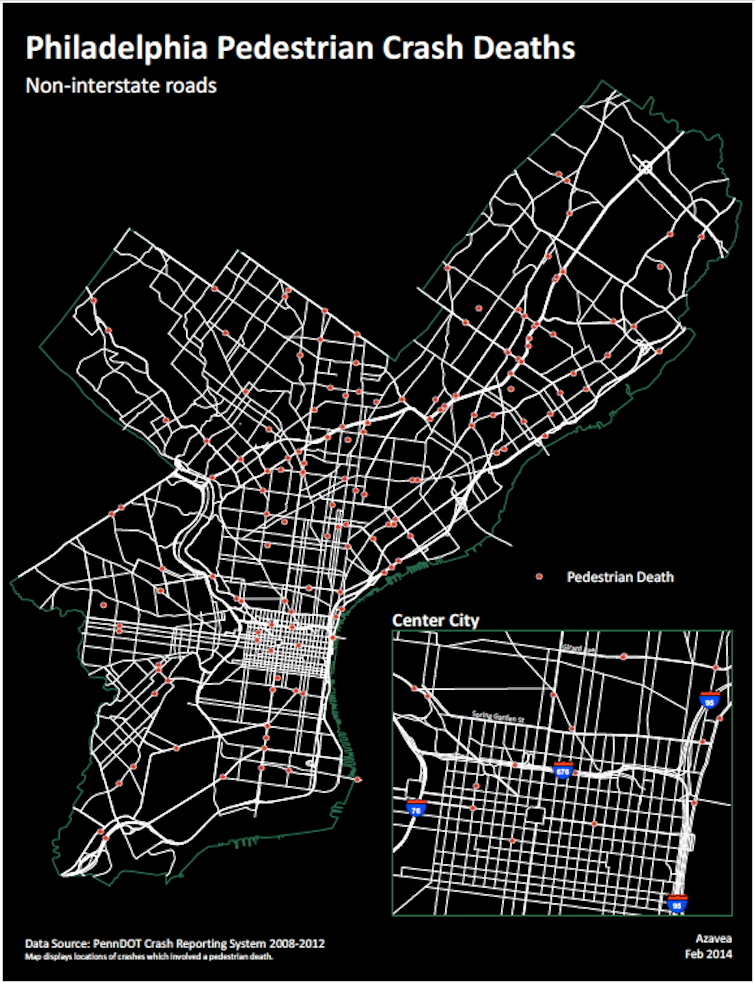
And here are pedestrian crash hotspots:
Center City is an obvious pedestrian crash hotspot, because there are just a lot of cars and people in close quarters. The more interesting takeaway from this map is that there are several big clusters outside of Center City, too, and many of them are in low-income and middle-income neighborhoods.
There were 9051 pedestrian-related crashes between 2008 and 2012, of which 376 resulted in major injuries and 158 were fatal.
But of those 158 fatal crashes, only 16 were in Center City:
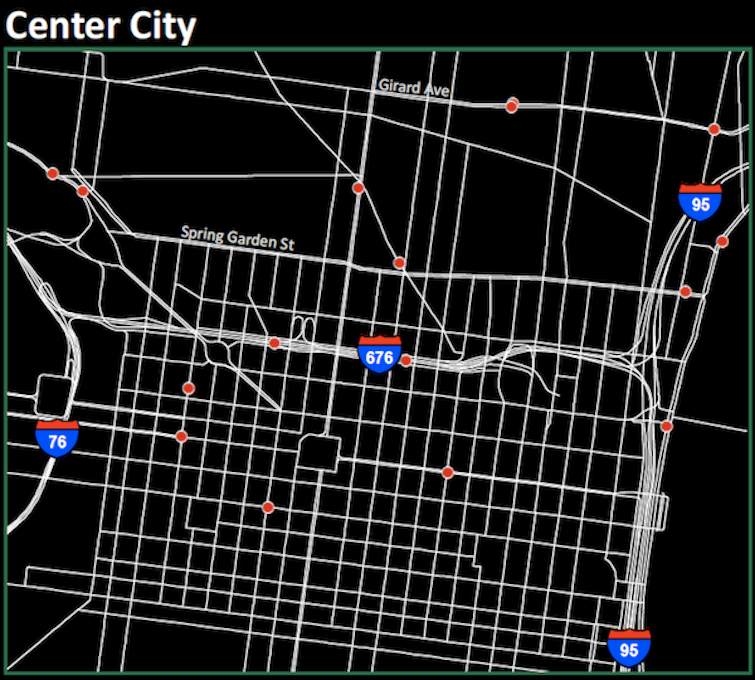
The most likely reason Center City has a smaller share of pedestrian deaths than lower-income neighborhoods, despite being a huge pedestrian crash hot spot, is that operating speeds are lower. The combination of narrow lanes, dense pedestrian foot traffic, cobblestones, and bike lanes and curb bumpouts all slow cars down.
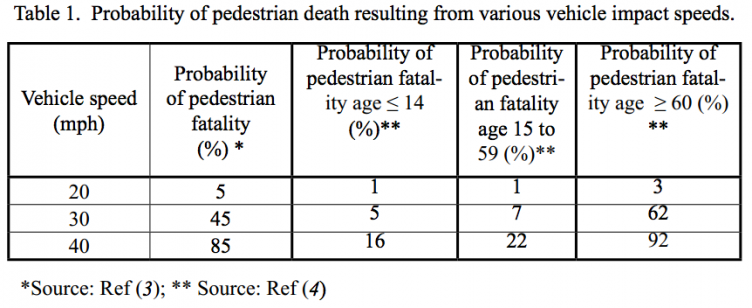
In more auto-centric areas, where levels of service for cars are higher, crashes are more likely to be fatal. The odds that a pedestrian will die from a car collision go up dramatically from 5% at 20 mph to 45% at 30 mph.
In New York City, traffic calming and safety equity have achieved the status of real political issues in the past few years, with City Council members championing 20 mph slow zones in the outer boroughs, as part of Bill DeBlasio’s Vision Zero plan to cut traffic deaths.
Is this going to become an issue in the 2015 elections in Philadelphia? It’s easy to see how this kind of information could be politically useful. If the purpose of CSI is to use data to empower neighborhoods outside of Center City in the annual budget debates, these maps suggest Council members whose districts overlap these areas may have a stronger claim on Streets Department and PennDOT resources for traffic calming interventions than some of the wealthier areas.
Check out the map tool below and click on the street segments to see which areas of your neighborhood have the highest pedestrian crash rates:
WHYY is your source for fact-based, in-depth journalism and information. As a nonprofit organization, we rely on financial support from readers like you. Please give today.
Brought to you by PlanPhilly

PlanPhilly
In-depth, original reporting on housing, transportation, and development.

‘Yes in God’s backyard’: Upper Merion church transforms vacant building into affordable housing
Construction on the 20-unit rental complex is expected to be completed by early 2027.
2 days ago
Listen 0:57
SEPTA board approves budget and bus route changes
In the works for years, the changes are designed to streamline service and will cause some people to make multiple route changes to replace what was once a one-vehicle ride.
2 days ago
Listen 1:05
Phase-one costs of the Edgemoor container terminal construction have ballooned from $415 million to $669 million.
3 days ago
Listen 0:50