Car-free in Philly: What one household gained by giving up its car

When Community Contributors Katy and Erik Johanson decided to sell their car, the savings they reaped by going car-free were “real and astounding.” Here the Johansons share their story and ponder what broader economic benefit could be unlocked for more Philadelphians through policies that focus on decreasing household transportation costs.
When we got married in 2012, common advice from friends and family was financial transparency. Too many marriages are strained by uncontrolled spending, they reasoned. Just keep tabs on it and we’d be fine.
So we set up a spreadsheet. Every Sunday evening, we log our weekly expenses by category: housing, food, clothing, healthcare, transportation, student loans, and other things like donations to our church and entertainment. After doing this consistently for more than three years, we now have a robust dataset that helps with not only financial transparency but also planning for major life changes.
One such change happened in 2013. Katy decided to leave her job as a nurse practitioner in Wilmington for a job in Center City. At the time, we lived in West Philadelphia within a five minute walk of four SEPTA trolley lines. Instead of commuting 40 minutes each day to Delaware by car, she could now commute 20 minutes downtown by trolley.
Erik was already a SEPTA commuter (full disclosure: he is also a SEPTA employee). For several months, we kept the car parked out front, hardly ever using it – but assuming at some point we would. Thanks to our weekly budget updates, we quickly realized that this was an expensive back-up plan. At 14%, transportation was our second biggest expense behind only housing. With so many alternatives and both of us working in Center City, did we still need the monthly car payments and insurance?
Having both grown up in car-oriented suburbs, this was a difficult decision. How does anyone live without a car? But at the same time, we were saving for a down payment on a house, and it was taking longer than we had hoped. So in November 2013, we took the plunge and sold the car. Car-free for the first time, we decided to supplement our SEPTA passes with a car-share membership and pair of bicycles.
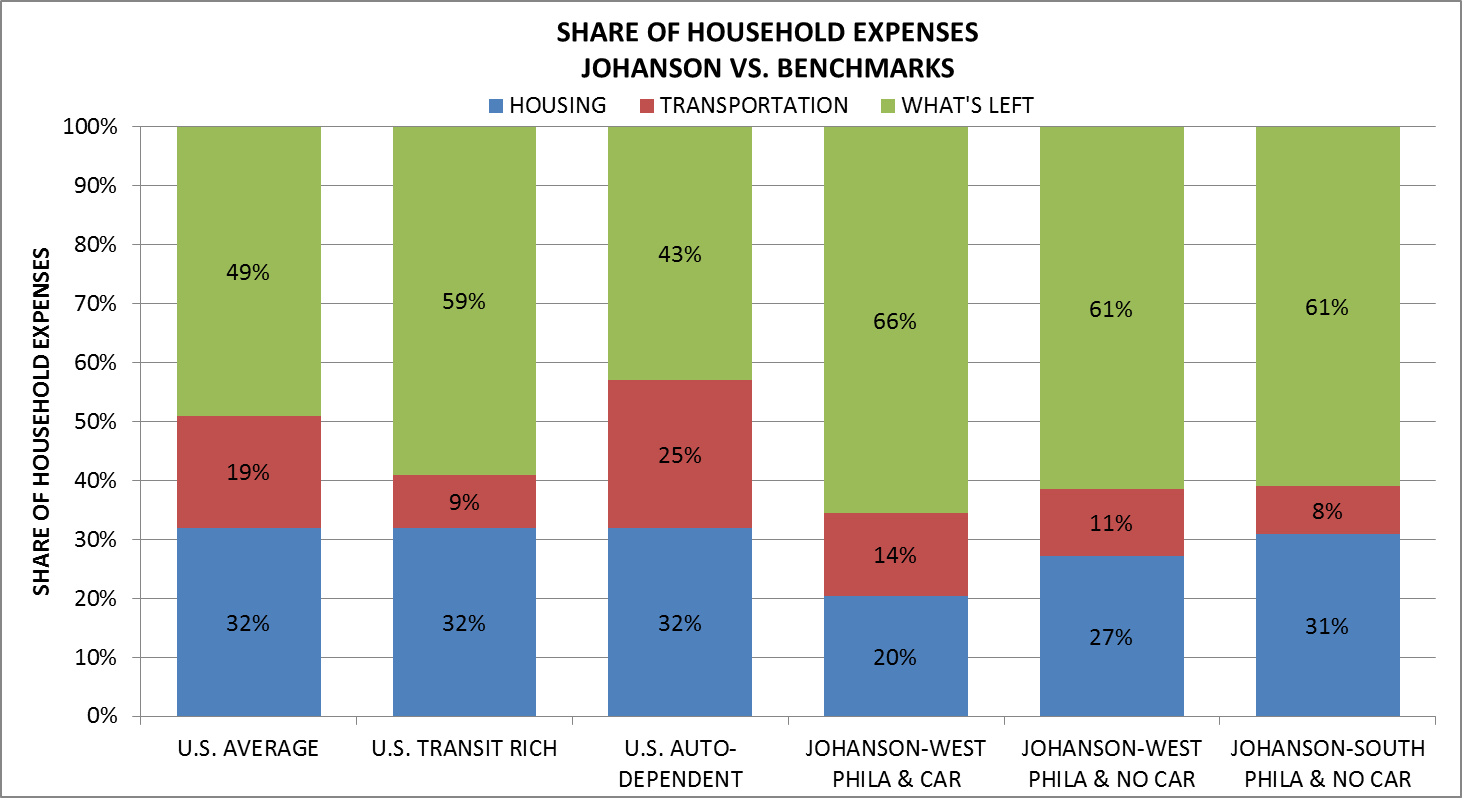
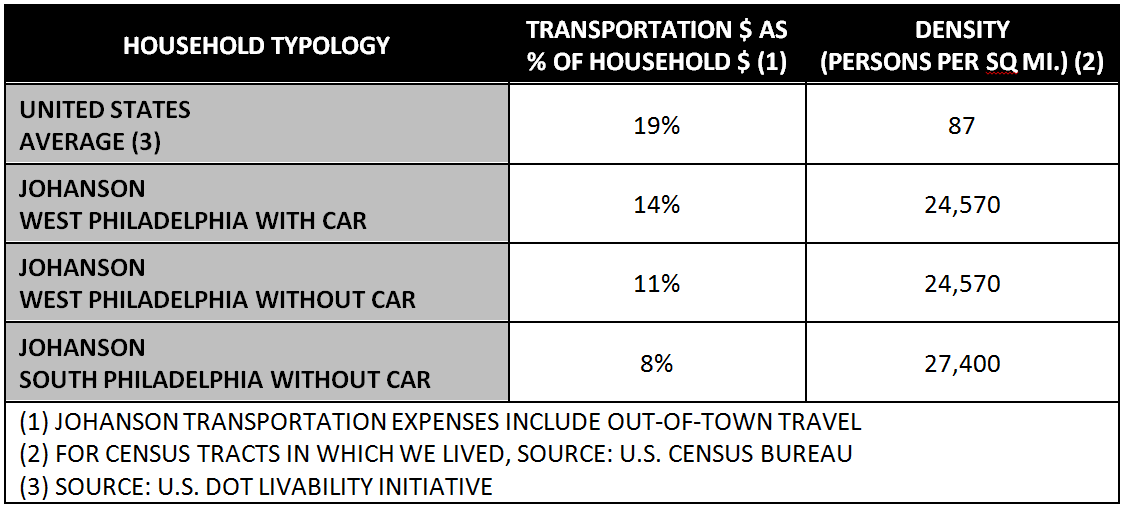
The savings we had hoped for were real and astounding. In 2014, our transportation expense share dropped from 14% to 11%. In late 2014, we bought a house in South Philadelphia. Our 2015 year-to-date transportation expense share is 8%. Transportation, once ranked second among all our household expenses, is now fifth behind housing, food, donations, and student loan repayments.
(A brief note on the calculations: we include both “around-town” and “out-of-town” travel in the transportation category, and within around-town, the full value of a TransPass for Erik, who can use the SEPTA system with his employee pass. “Actual” around-town expenses are actually only 3% in 2015 year-to-date.)
Fascinated by the magnitude of these savings, we did some research and found that our experience is in line with national trends. According to the U.S. Department of Transportation’s “Livability Initiative”, the average American household spends 19% on transportation. But households in “auto-dependent” areas spend 25% on transportation, while households in “transit rich” areas spend just 9% on transportation. Interestingly, all three of U.S. DOT’s household typologies spend roughly the same amount on housing (32%), so “what’s left” is highly dependent on the transportation costs associated with where you live.

In our case, the difference between the 19% American average and what we spent in West Philadelphia with car (14%) could be considered “the city dividend” – 5 percentage point savings from shorter trips associated with living in relatively close proximity to most destinations. The difference between West Philadelphia with car (14%) and without car (11%) could be considered “the car-free dividend” – 3 percentage point savings resulting from cheaper mobility options. The difference between West Philadelphia without car (11%) and South Philadelphia without car (8%) could be considered “the density dividend” –another 3 percentage point savings resulting from living in a neighborhood where most trips are even shorter and are often best served by walking.

These benchmarks could have powerful implications as an economic development strategy in Philadelphia. If housing costs are relatively fixed as a percentage of household expenses, reducing the share of transportation costs may be one of the best opportunities for an equitable economic stimulus across all income levels.
Consider the benchmarks in the context of Philadelphia’s 580,017 households, with a median household income of $37,192 (Source: 2013 American Community Survey). Assuming for the sake of simplicity that income equals expenses (i.e., no savings), the move from 19% to 14% of household expenses would save the median Philadelphia household $1,860 per year. The move from 14% to 11% would save another $1,116. And the move from 11% to 8% would save another $1,116. Overall, reducing transportation from 19% to 8% of expenses would save the average Philadelphia household $4,092, or $2.37 billion in savings across Philadelphia’s 580,017 households. It is reasonable to assume that a significant portion of these savings would ultimately be spent locally, re-circulating and multiplying economic benefits.
Of course, these calculations come with all kinds of caveats. For one, 41% of Philadelphians already commute by some other means than car (public transit, walk, bike, other) and 33% of households already do not own a vehicle. Both rates are in the top five among large cities in the United States. So some percentage of that $2.37 billion in savings is already circulating through the local economy.
From a practical standpoint, however, not every trip in the Philadelphia region is effectively served by walking, biking and public transit, and so the notion of a broad economic stimulus from reduced transportation costs remains somewhat elusive. Many jobs in the Philadelphia region have been located so far from the transit network that they are virtually inaccessible by anything but a car. Katy’s job in Delaware was a case in point. For many, car ownership and use remains an economic necessity. As such not every Philadelphian has the opportunity to move along this continuum of transportation cost savings for their own household.
But to the extent that there are both macro policy-level and personal life choices that can move the needle towards lowering overall transportation costs in Philadelphia, it’s useful to think about often difficult and sometimes controversial decisions to reduce car dependency in the context of actual dollar savings for individuals and families. It’s not for everyone, we admit, but we also know many people who treat car ownership like the necessary back-up plan as we once did. The choice to forgo the car allowed us to buy a house sooner, donate more to our church, and we still have the financial flexibility for an occasional night out or a trip to see family. For us, these are the tangible financial benefits of living car-free in Philadelphia.
—————————————
Have bright ideas or insights to share from your corner of the city? You too can be a Community Contributor. Drop us a line at EOTS@planphilly.com with your ideas for commentary.
WHYY is your source for fact-based, in-depth journalism and information. As a nonprofit organization, we rely on financial support from readers like you. Please give today.


