Philly’s school test scores largely flat in second year of tougher PSSAs

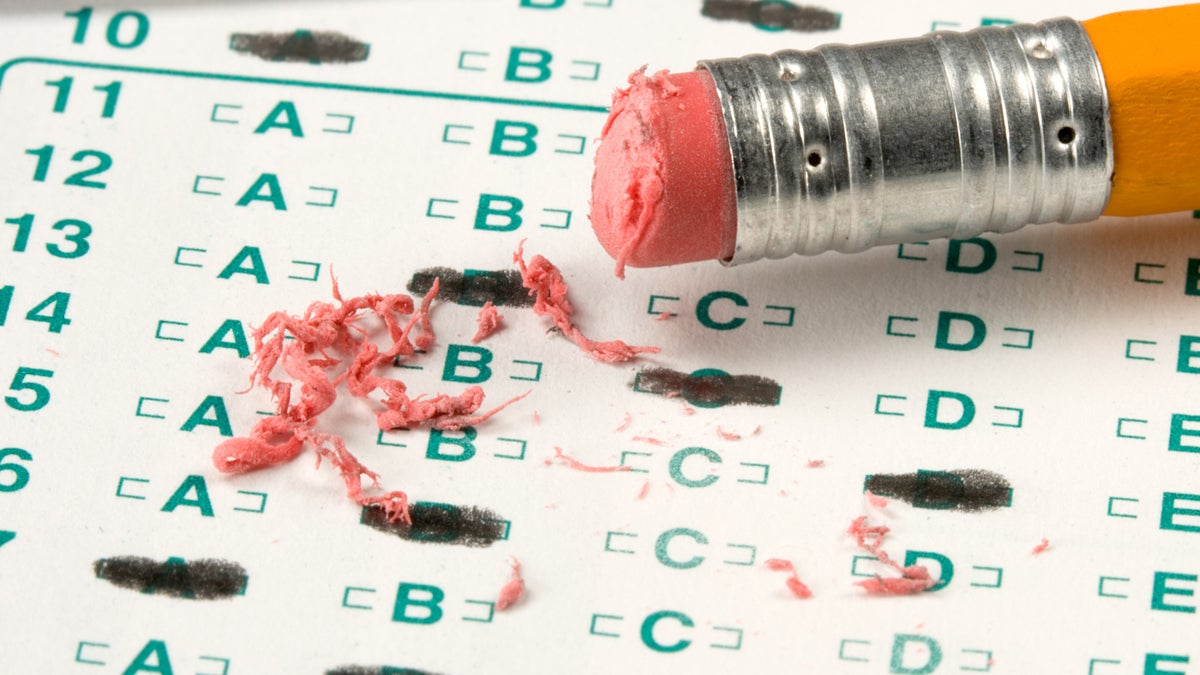
(Image via Shutterstock)
Standardized test scores for Philadelphia’s public school students remained largely flat in 2016, though high school students made some noteworthy progress, according to data released Thursday.
The data comes from tests taken this spring.
The 2015-16 school year was the second time Pennsylvania students took a revamped and substantially tougher version of the math and English PSSAs, tests the state administers to all third- through eighth-graders. In 2015, pass rates plummeted as teachers and students adjusted to the new tests, which were aligned to the Common Core State Standards.
Philadelphia’s scores stabilized this year, but did not improve.
For instance, 32 percent of district students scored proficient or better on the state’s English language arts exam, the same number who hit the proficiency benchmark last year. In math, 18 percent of district students were deemed proficient — up from 17 percent the year before. The number of students who reached proficiency in science fell slightly, from 37 percent in 2014-15 to 36 percent in 2015-16.
The district did notch some notable gains on the Keystone Exams, another set of standardized assessments given to the state’s high schoolers. Proficiency rates climbed 6 percentage points in literature (49 to 55 percent); 5 percentage points in algebra I (38 to 43 percent); and 7 percentage points in biology (29 to 36 percent).
“We are proud of the improvements in Keystone proficiency across all subjects. These results show we are making progress as we continue to ensure all students are ready for a career or college,” said district superintendent William Hite. “While PSSA scores were stable, there are multiple ways to measure our students’ knowledge and mastery of skills, and our students continue to make gains.”
The district’s improvements on the Keystone exams outpaced those of the state as a whole. In literature, algebra and biology, state Keystone scores increased 4 percent, 3.7 percent, and 6.8 percent respectively. District scores jumped either as much or more in all three categories.
Keystones were originally conceived as a graduation requirement for Pennsylvania students, although a recent delay guarantees students won’t have to pass them until 2019 at the earliest.
This chart compares the change in Philadelphia’s Keystone scores from 2015 to 2016 with the statewide change.
| SUBJECT | PHILADELPHIA % CHANGE | STATEWIDE % CHANGE |
| LITERATURE | +6.0 | +4.0 |
| ALGEBRA I | +5.0 | +3.7 |
| BIOLOGY | +7.0 | +6.8 |
The reverse was true, however, for PSSAs. On that set of exams Philadelphia students generally underperformed compared to state trends. For the 2014-15 school year, the state did not use PSSA scores to calculate a School Performance Profile (SPP) for each of the state’s public schools. The state will, however, tabulate SPP scores this year. The state announced Thursday those figures will be released next month.
The charts below compare changes in Philadelphia’s PSSA scores from 2015 to 2016 with changes statewide.
| GRADE | PHILADELPHIA % CHANGE (MATH) | STATEWIDE % CHANGE (MATH) |
| 3 | +3.0 | +5.9 |
| 4 | +1.0 | +2.2 |
| 5 | +0.0 | +1.6 |
| 6 | +0.0 | +1.4 |
| 7 | +2.0 | +4.0 |
| 8 | +0.0 | +1.4 |
| GRADE | PHILADELPHIA % CHANGE (ENGLISH) | STATEWIDE % CHANGE (MATH) |
| 3 | -3.0 | -1.1 |
| 4 | +0.0. | +0.1 |
| 5 | +0.0 | -0.4 |
| 6 | +3.0 | +1.0 |
| 7 | -1.0 | +2.9 |
| 8 | +0.0 | +0.4 |
Note: The School District of Philadelphia reports scores rounded to the nearest whole number. The state reports scores rounded to the nearest tenth.
WHYY is your source for fact-based, in-depth journalism and information. As a nonprofit organization, we rely on financial support from readers like you. Please give today.


