


Philly’s affordable housing developments also rank high on transportation affordability

A new national study by two planning professors finds that Philadelphia ranks highly in terms of location affordability of housing units receiving federal rental assistance.
In recent years, the idea that housing and transportation costs need to be considered together has caught on among housing advocates, and also at the Department of Housing and Urban Development.
Housing far away from job centers may be lower cost, but if it’s outside the reach of frequent transit household transportation costs increase, cancelling out any housing savings.
The goal, then, is to find the sweet spots where combined housing and transportation costs are no more than 45% of household income (30% for housing, and 15% for transportation). The upshot is that more compact urban areas start looking more affordable compared to suburban or rural locations, even if their nominal housing costs are higher.
Building on the Center for Neighborhood Technology’s H+T (Housing + Transportation) Index , HUD created a Location Affordability Index (LAI) which uses Census data to rate the location affordability of any given address. But so far HUD hasn’t taken the next step of using this metric to guide policy or funding decisions. That’s where the new study comes in.
Professors Shima Hamidi and Reid Ewing looked at a large national sample of the approximately 34,000 properties listed in HUD’s Multifamily Portfolio Dataset, and created a model of transportation costs for these places using household survey data from 13 diverse regions—a big improvement on the H+T and LAI methodology.
The H+T Index and LAI both used aggregate Census data from just a few regions to build their models, while the more granular regional data on automobile capital costs, operating costs, and transit fares allowed Hamidi and Ewing to get a clearer picture of the cost of living, and drill down specifically into more than 18,000 HUD rental assistance properties.
The big topline finding is that the average percentage of income spent on transportation is 15% for low-income households at the high end of the eligibility scale, but in “highly sprawling metropolitan areas” and the suburbs of more compact metros, much higher percentages of households exceed that 15% threshold.
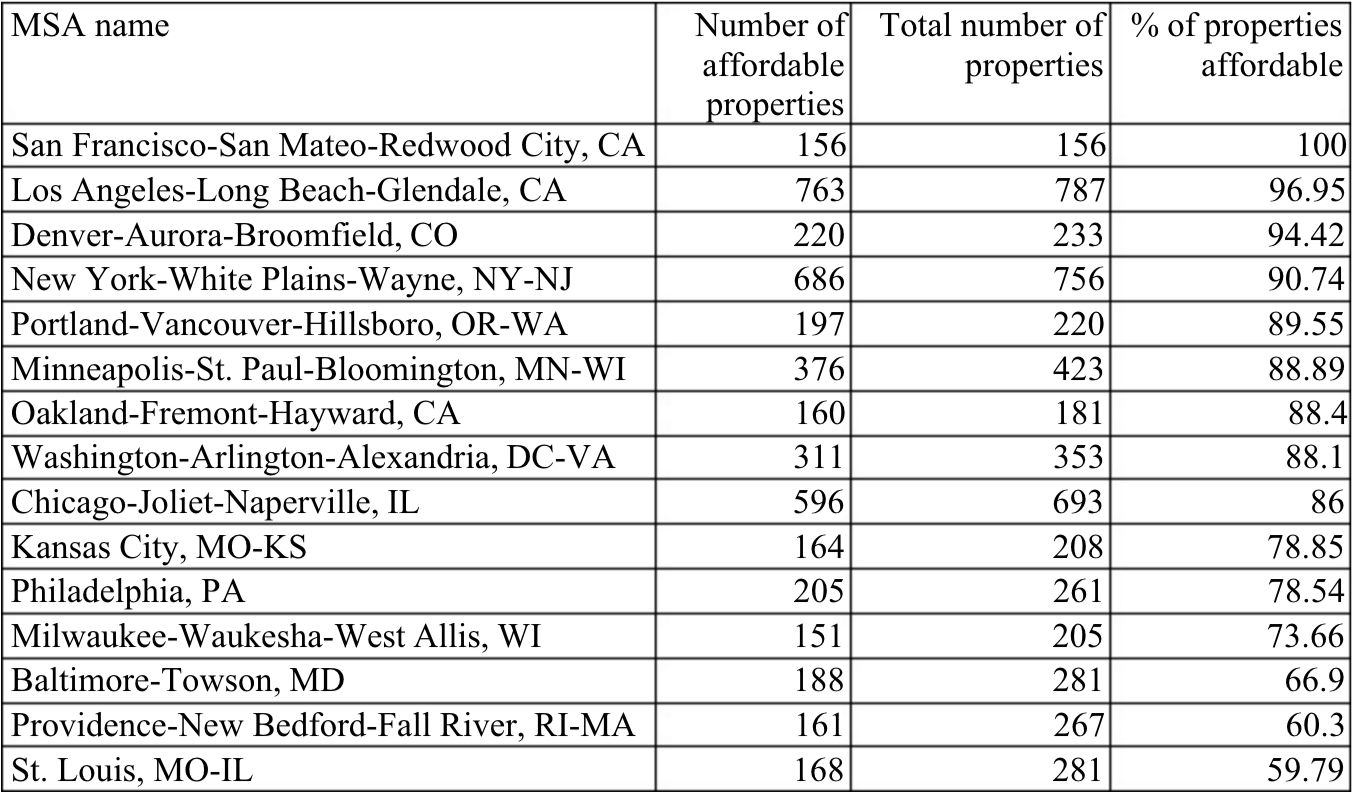
Philadelphia stacks up very well by their measures, with around 78.5% of HUD assisted households in affordable locations. By contrast, across the state in Pittsburgh only about 18% of such properties make the grade.
“A typical low income household, which is qualified for HUD assistance program in downtown Los Angeles, spends only $1,988 per year on transportation which is less than 3.5% of its budget,” they write, “The same household in a property in a distant and inaccessible location in Portland, ME spends $13,950 (28 percent of its budget) on transportation.”
The takeaway for federal policy, the authors suggest, is that “locational characteristics of properties should be considered by HUD when establishing eligibility for rental assistance subsidies” with the goal of steering recipients toward housing in more compact, transit-served locations.
The location affordability conversation is much bigger than just rental assistance properties though, and the larger significance arguably has more to do with local zoning: How much housing is allowable within easy reach of frequent transit service?
Back in 2014, the University of Minnesota’s Center for Transportation Studies published maps for 46 major U.S. metros that measured transit access to jobs, using Census data. Darker areas have access to more jobs within a 30-minute travel window, and lighter areas have access to fewer jobs.
Here is the map of Philadelphia:
If location affordability is the priority, the darker orange and yellow areas are the preferred locations to absorb new housing units, whether market-rate or subsidized, because they have the best transit access to the greatest number of jobs. As such, these are the areas where it’s most plausible to save money by forgoing car ownership.
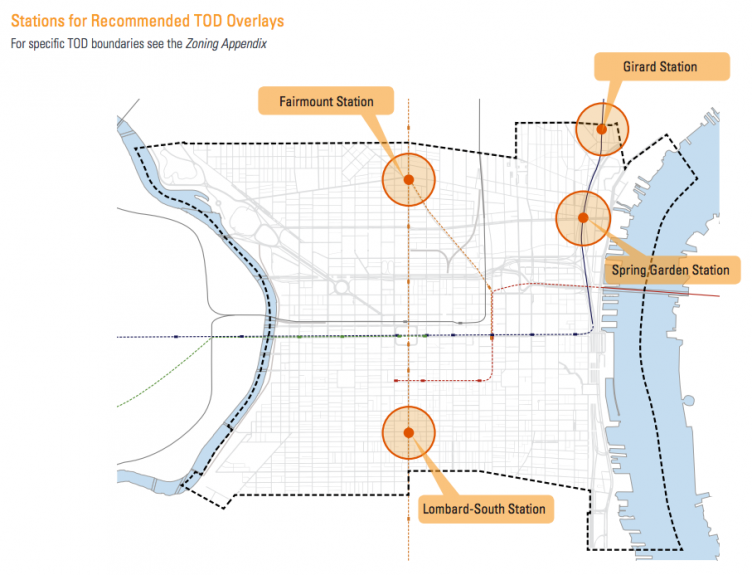
The 2012 zoning code reforms created a framework for transit-oriented development (TOD) overlay districts, which would enable denser development and allow more housing units within a quarter-mile area around designated transit stations, but so far City Council members have not elected to create any such overlays.
The Philadelphia City Planning Commission has recommended TOD districts around the Lombard-South and Fairmount stations on the Broad Street Line, and the Spring Garden and Girard Avenue stations on the Market Frankford Line. The areas around Cecil B. Moore station near Temple, and the MFL station at 46th and Market have also been targeted as ideal sites for transit-oriented zoning.
WHYY is your source for fact-based, in-depth journalism and information. As a nonprofit organization, we rely on financial support from readers like you. Please give today.
Brought to you by PlanPhilly

PlanPhilly
In-depth, original reporting on housing, transportation, and development.
")
Big Fix: Solutions to the housing crisis
In this month's Big Fix episode: the housing crisis. Flexible zoning, more vouchers, accessory dwelling units, YIMBYISM and more.
Air Date: July 29, 2026 12:00 pm
Listen 51:53
A vacant 126-year-old school in Strawberry Mansion will become senior housing
The $34 million project will repurpose the historic property through a partnership with the Philadelphia Housing Authority.
1 week ago

A vacant church in Philadelphia’s Strawberry Mansion will become workforce housing
The $10 million project will reuse Cornerstone Baptist Church on North 33rd Street. The property has sat vacant for more than five years.
2 weeks ago
Listen 0:45