Philly’s affordability disadvantage: high transportation costs and low wages
The Martin Prosperity Institute (Richard Florida, et al.) is out with a new report looking at the class geography of several major U.S. cities, which finds more affluent professionals are populating urban centers, and especially neighborhoods near transit and clusters of higher-paying jobs, including Philadelphia.
Alexis Stephens at Next City points out that MPI forgoes long-used terms of class in favor of three newer terms (creative class, service class, and working class) that define class by occupation.
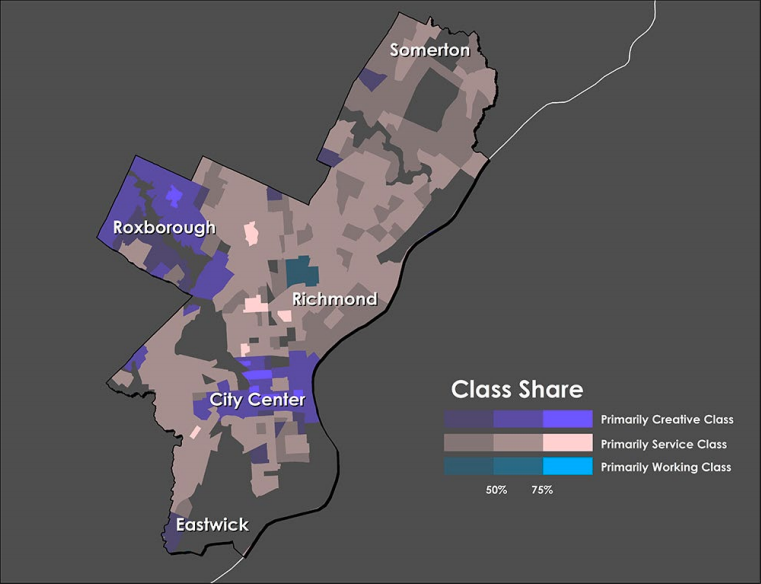
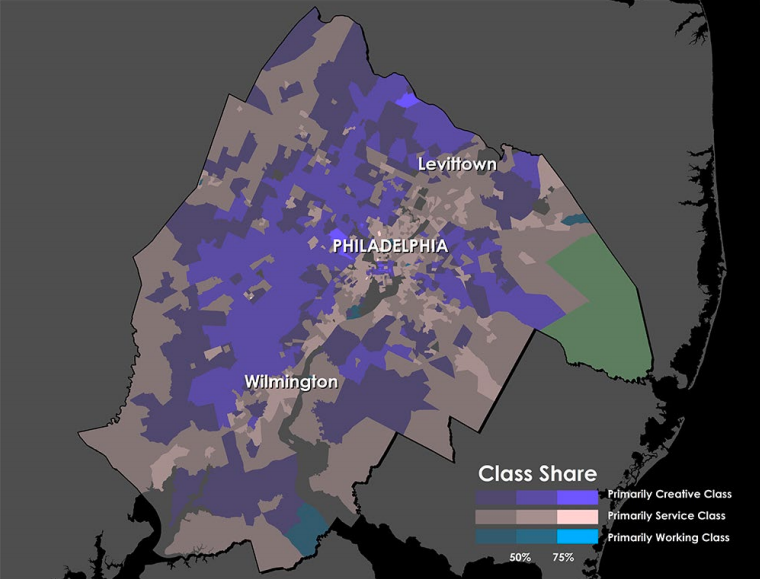
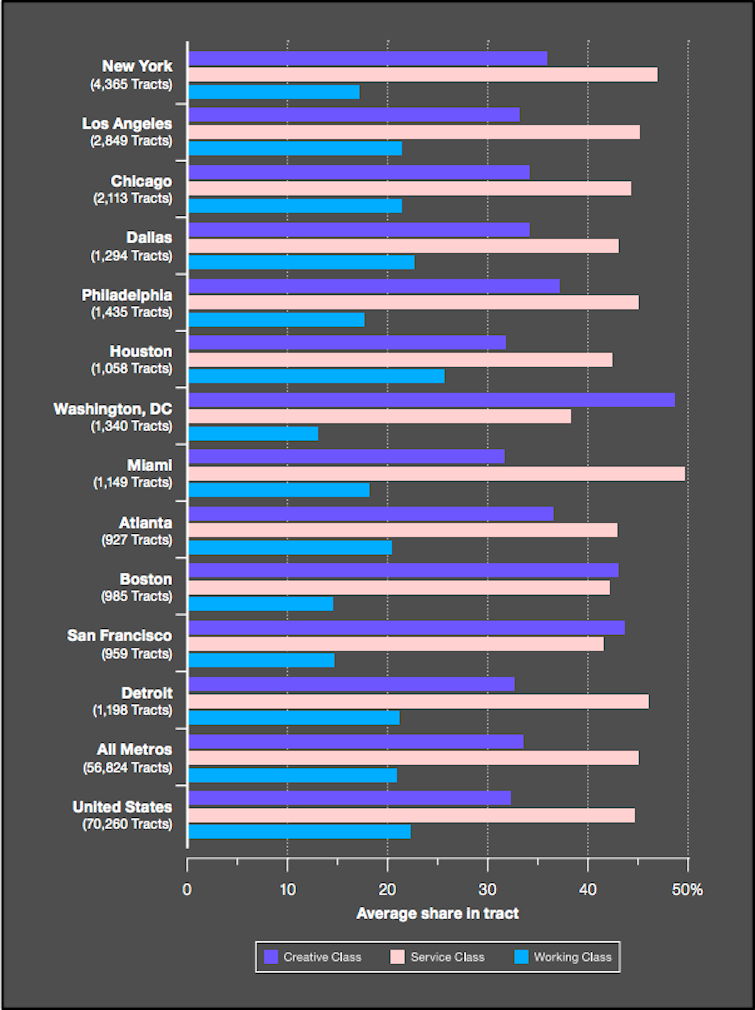
Philadelphia’s working class has a lower share of the population than the other 12 metros MPI looked at, and the report drives home how complete our transition to a service economy is:
Here are their class maps of the city and the region:
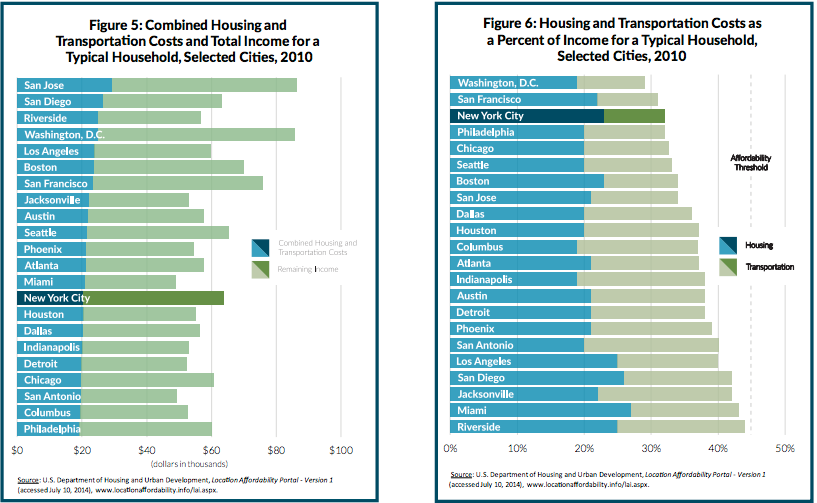
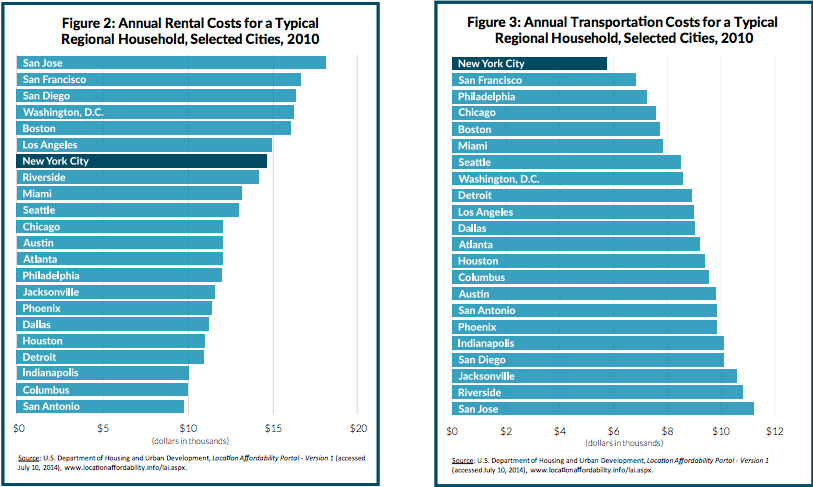
The story isn’t new, but it’s useful to consider MPI’s chart comparing average wages in different cities with the NYC Citizens’ Budget Commission’s comparison of housing and transportation costs when thinking about the implications for policy, since these are the two largest monthly expenses for most households:
MPI is using 2010 data, the Citizen’s Budget Commission is using 2014 data, so the comparison is inexact, but the broad trends are clear and largely confirm what we already know.
The wage chart shows that Philly’s wages are lower than our big peer cities in NYC and DC. But wages can’t be considered in isolation, of course. The relevant margin is really purchasing power – how far does your paycheck go?
And that’s why the second chart is so important. If Philly’s service sector wages are a bit lower than NYC’s, that’s only really a problem if it means Philadelphians can buy less stuff than people who work similar jobs in NYC.
When it comes to housing, that does not appear to be the case. Average New York service sector wages are higher than Philly’s by $2,548, but the typical NYC household spends about $3,000 more per year than the typical Philadelphia household, so the higher wages mostly get eaten up by higher housing costs. The same amount of money will also buy you more square footage or a nicer location in Philadelphia, so when quality considerations are included, Philly comes out looking like a better value.
But when transportation costs are added in, Philly’s affordability advantage disappears. The Center for Neighborhood Technology’s H+T Index confirms that only a very small area of Philadelphia has combined housing and transportation costs that fall under CNT’s recommended ratio of 45% of median income, and the issue is transportation.
In recent months, metro Philly’s rents have been flat-lining at a little over $1.25 a square foot, even as they’ve been trending up in a few specific close-in neighborhoods.
Maintaining sufficient supply of housing construction to keep rents flat will certainly require active engagement from affordability advocates, but the data suggest that the highest-impact pro-affordability actions will be those that reduce the cost of transportation (crucially, by extending to more Philadelphians real choices to forgo expensive car ownership through more frequent transit service, more and denser housing construction near transit stations, and expansion of car-sharing and ride-sharing usage) alongside policies like raising the minimum wage.
WHYY is your source for fact-based, in-depth journalism and information. As a nonprofit organization, we rely on financial support from readers like you. Please give today.

