New raft of data sets stage for debate over school property tax elimination in Pa.
These new reports — heavy with charts and computations — will likely inform arguments made for and against property tax abolition.
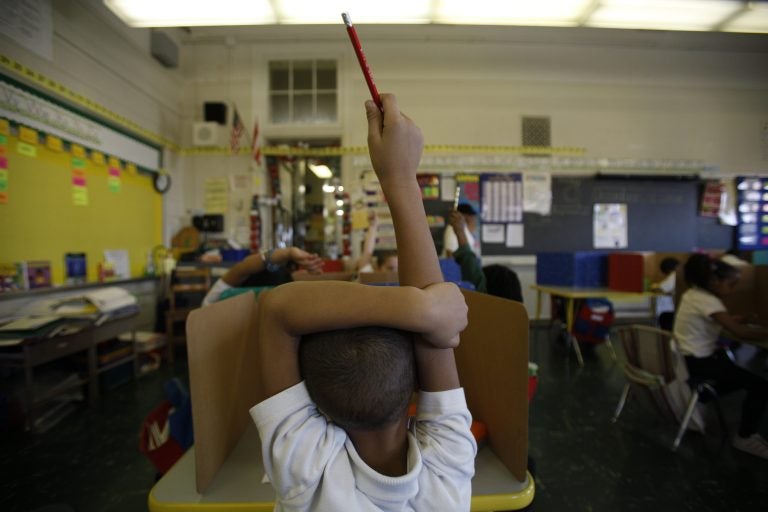
A student raises his hand at Isaac Sheppard School in Philadelphia, Pennsylvania. (Jessica Kourkounis for Keystone Crossroads)
In the past month and a half, Harrisburg’s nonpartisan Independent Fiscal Office has released four research briefs or special reports.
Three of those four have been about property taxes, and they may soon factor into a major policy debate.
In November, Pennsylvania voters approved a constitutional amendment that could make it easier for the state to eliminate property taxes on individual homeowners. But that ballot measure in and of itself does nothing to change state law. It merely paves the way for state lawmakers to pass new legislation that could achieve that end.
These new reports — heavy with charts and computations — will likely inform arguments made for and against property tax abolition.
The most recent report took a county-by-county look at the proportion of property tax revenue generated by homesteads. In 22 counties, the majority of this revenue comes from commercial properties.
This is true of Philadelphia, for instance, where only 36 percent of property tax revenue comes from homesteads. At the other end of the spectrum there’s Perry County, pop. 48,500, which traces the Susquehanna River Northwest of Harrisburg. There, homeowners provide two-thirds of the property tax revenue.
The constitutional amendment approved in November allows state lawmakers to eliminate property taxes on homeowners while continuing to tax commercial properties. This could help appease critics of the plan who fear abolition could amount to a corporate handout.
The previous proposal sought to phase out the $12.6 billion currently raised for schools through local commercial and residential property taxes, and replace revenue at existing rates by hiking state sales and income taxes. Now, lawmakers could theoretically target just the $7.7 billion collected from owner-occupied properties.
The latest IFO report shows where that replacement revenue would go in a scenario where only homeowners were exempted. Places like Perry County would get proportionally more of the fill-in dollars. Greene County — on Pennsylvania’s Southwest border — would get much less, since only 23 percent of the county’s property taxes come from the pockets of homeowners.
To see where your county ranks, click here.
Effect on seniors
Another recent IFO report, crafted in response to a request by State Rep. Jim Cox (R-Berks County), a property tax opponent, examined the tax burden on Pennsylvania’s seniors.
Those who advocate eliminating property taxes typically highlight the plight of retirees. Older Pennsylvanians, they say, are more likely to have fixed incomes and, therefore, struggle to keep pace with ballooning property tax bills.
The IFO’s analysis didn’t delve into what percentge of seniors’ income goes toward taxes. It did, though, show how much seniors contribute to the overall property tax pie.
Pennsylvanians 60 and older account for 43.8 percent of all property taxes paid by individual homeowners. In lump sum, that comes out to almost $3.4 billion every year.
“The Independent Fiscal Office quantified what Representative Cox and I have heard for years,” said State Sen.David Argall (R-Schuylkill County), a leading property tax opponent. “School property tax unfairly targets seniors because it’s a tax that isn’t based on your ability to pay.”
But the IFO’s numbers also reveal some noteworthy nuances that could fuel Argall’s critics. While Pennsylvanians 60 and older pay 43.8 percent of school property taxes from owner-occupied properties, they actually own 45.5 percent of homes. This discrepancy holds true for Pennsylvanians 65 and older and Pennsylvanians 70 and older.
That means seniors actually pay less per homeowner than the average Pennsylvanian, which somewhat dulls the argument that property tax unduly burdens the elderly. The numbers make sense to Mark Ryan, the deputy director of the IFO, because people tend to live in smaller homes as they age and their children move out.
“It might represent a small property, the effect of downsizing,” said Ryan.
The IFO’s analysis doesn’t include any cross-state comparisons, so it’s tough to know if Pennsylvania’s seniors carry a larger burden than their peers across the country.
The U.S. Census does break down home ownership by age and state, with estimates that update yearly. The 2016 figures — which are different than the data the IFO used — show that 41.4 percent of owner-occupied households in Pennsylvania are owned by householders 60 or over. That mark places Pennsylvania slightly above the national average of 40.6 percent, and ranks it 18th among all states.
Florida (49.6 percent), Hawaii (49.3 percent), and Arizona (45.6 percent), have the highest proportion of homes owned by citizens 60 or older. Alaska (32.8 percent), Utah (33.2 percent), and Minnesota (35. 8 percent) bring up the rear.
Renters, most burdened counties
The other recent IFO report, which came out in November, looked at the potential impact of an actual property tax proposal put before the legislature. Senate/House Bill 76 called for increases in the personal income tax and the sales and use tax to make up for the elimination of property taxes.
The IFO’s analysis looked at how much more Pennsylvanians might have to pay in those replacement taxes. The IFO estimated the bump in sales tax would cause Pennsylvanians earning between $40,000 and $70,000 a year to pay between $200 and $400 more at the register.
The IFO went even deeper on changes to the personal income tax. The office assembled a county-by-county analysis to look at how the adjustment would play across the state.
The IFO established the median household income for each county and then looked at how much more those households would pay in personal income tax under Senate/House Bill 76.
At the low end was Fayette County in Southwestern Pennsylvania, where the median household would cough up an extra $745. In wealthy Chester County, right outside Philadelphia, the bump would be $1,616.
The IFO also broke out the impact on renters and homeowners, tallied up the share of elderly homeowners in each county, and calculated how much the average homestead pays in property tax.
Renters, because they earn less on average, would notice a proportionally smaller bump in their personal income taxes. The median homeowner would pay an extra $1,008 each year in income tax, while the median renter would fork over $576.
A previous IFO report found that S.B. 76 would give homeowners a windfall gain, predicting the move would immediately boost home values. In the same report, it found that retirees who own their homes would benefit the most. Working renters — left at the mercy of landlords paying forward any of their benefit — would take on the greatest new tax burden.
Statewide, Pennsylvanians over 65 make up a larger percentage of homeowners than they do renters. Only 19.4 percent of renters are 65 or older. But among homeowners, 29.3 percent are 65 or above.
But those figures can, again, vary dramatically by county. In Forest County, just over half of all homeowners are over 65. Compare that to Centre County—home to Penn State University—where only one in ten renters is at least 65 years old.
Finally, there’s what Pennsylvanians actually pay in property taxes. The average homeowner in the state sends along $2,291 each year to help fund local schools. Again, though, the range is wide.
The median Bucks County resident in Southeastern Pennsylvania pays $4,546, more than eight times what the average Greene County resident pays. But for the most part, those discrepancies simply track wealth. In wealthier parts of the state, residents own more expensive homes and pay higher taxes.
But by cross-referencing median homeowner income with average property tax payments, the IFO data allows us to look for outliers. And there are some counties where residents pay significantly more or less than one would expect them to pay based on median income.
Take Monroe County in Northeastern, Pennsylvania, for instance. The median homeowner there makes $66,087 a year, about in line with the state average. But the county’s average homeowner pays $3,124 in property tax, nearly $1,000 more than the typical Pennsylvanian.
On the other side of the ledger there’s Greene County, that familiar outlier. The average Greene County homeowner has the lowest property tax bill in the Commonwealth, even though the median homeowner income is closer to the middle of the pack.
The scatterplot below shows the distribution of counties based on median income and property tax burden. Those above the trend line pay more than one would expect. Those below, pay less.
WHYY is your source for fact-based, in-depth journalism and information. As a nonprofit organization, we rely on financial support from readers like you. Please give today.
