


How 7,000 PlanPhilly stories can tell us where we’ve been, where we’re going

From the introduction of William Penn’s street grid; to Ed Bacon’s Renewal-era neighborhood planning; to the challenge today of balancing growth and equity – Philadelphia’s history reflects societies’ unfinished ambition for creating socially and economically progressive communities.
While these issues and others are of national import, they are often reported within the urban context because cities produce them at much larger relative densities.
While the last decade has seen an explosion of urban-centric online media, PlanPhilly’s more local focus has helped it differentiate itself. Unlike many of its peer publications, PlanPhilly reports on planning and policy issues that directly effect Philadelphia and its diverse citizenry.
This diversity is reflected in Figure 1 above which visualizes the frequency of words used in PlanPhilly titles since its inception in 2006.
The purpose of this piece is to highlight emergent planning themes in Philadelphia through the analysis and visualization of trends mined directly from PlanPhilly articles.
In February of this year, I wrote a similar meta-analysis article for the urban focused website Planetizen which writes for national and international audiences. For that article, myself and a colleague scraped more than 48,000 articles directly from the website.
This time around, the good folks at PlanPhilly made life easier by providing access to their database which includes data on article titles, authors, dates, number of article views and more for about 7,000 articles. When these data are analyzed, a narrative emerges highlighting issues of increasing importance to Philadelphians.
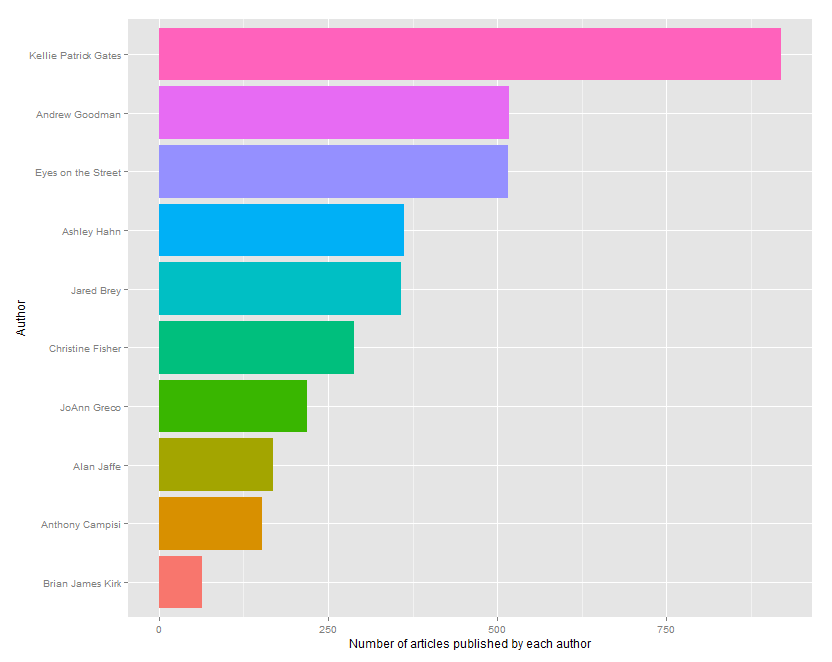
Let’s begin with the people who make PlanPhilly possible – its writers. Figure 2 below displays the ten most published PlanPhilly journalists ranked by the number of articles they’ve produced. For the record, before this article, I had published 5 articles which puts me both in good company and at a three-way tie for the 26th spot alongside scholar John Kromer and reporter Aaron Moselle.
Because planning is largely a placed-based enterprise, the next analysis makes use of the neighborhood tags associated with each PlanPhilly article. A bit of data wrangling is required to match neighborhood keywords from the articles with the neighborhood names in Philly’s open neighborhood map.
Figure 3 visualizes the total count of articles for neighborhoods where this match was a success. It’s clear that PlanPhilly focuses on issues important to a diverse group of neighborhoods – each with their own unique set of concerns.
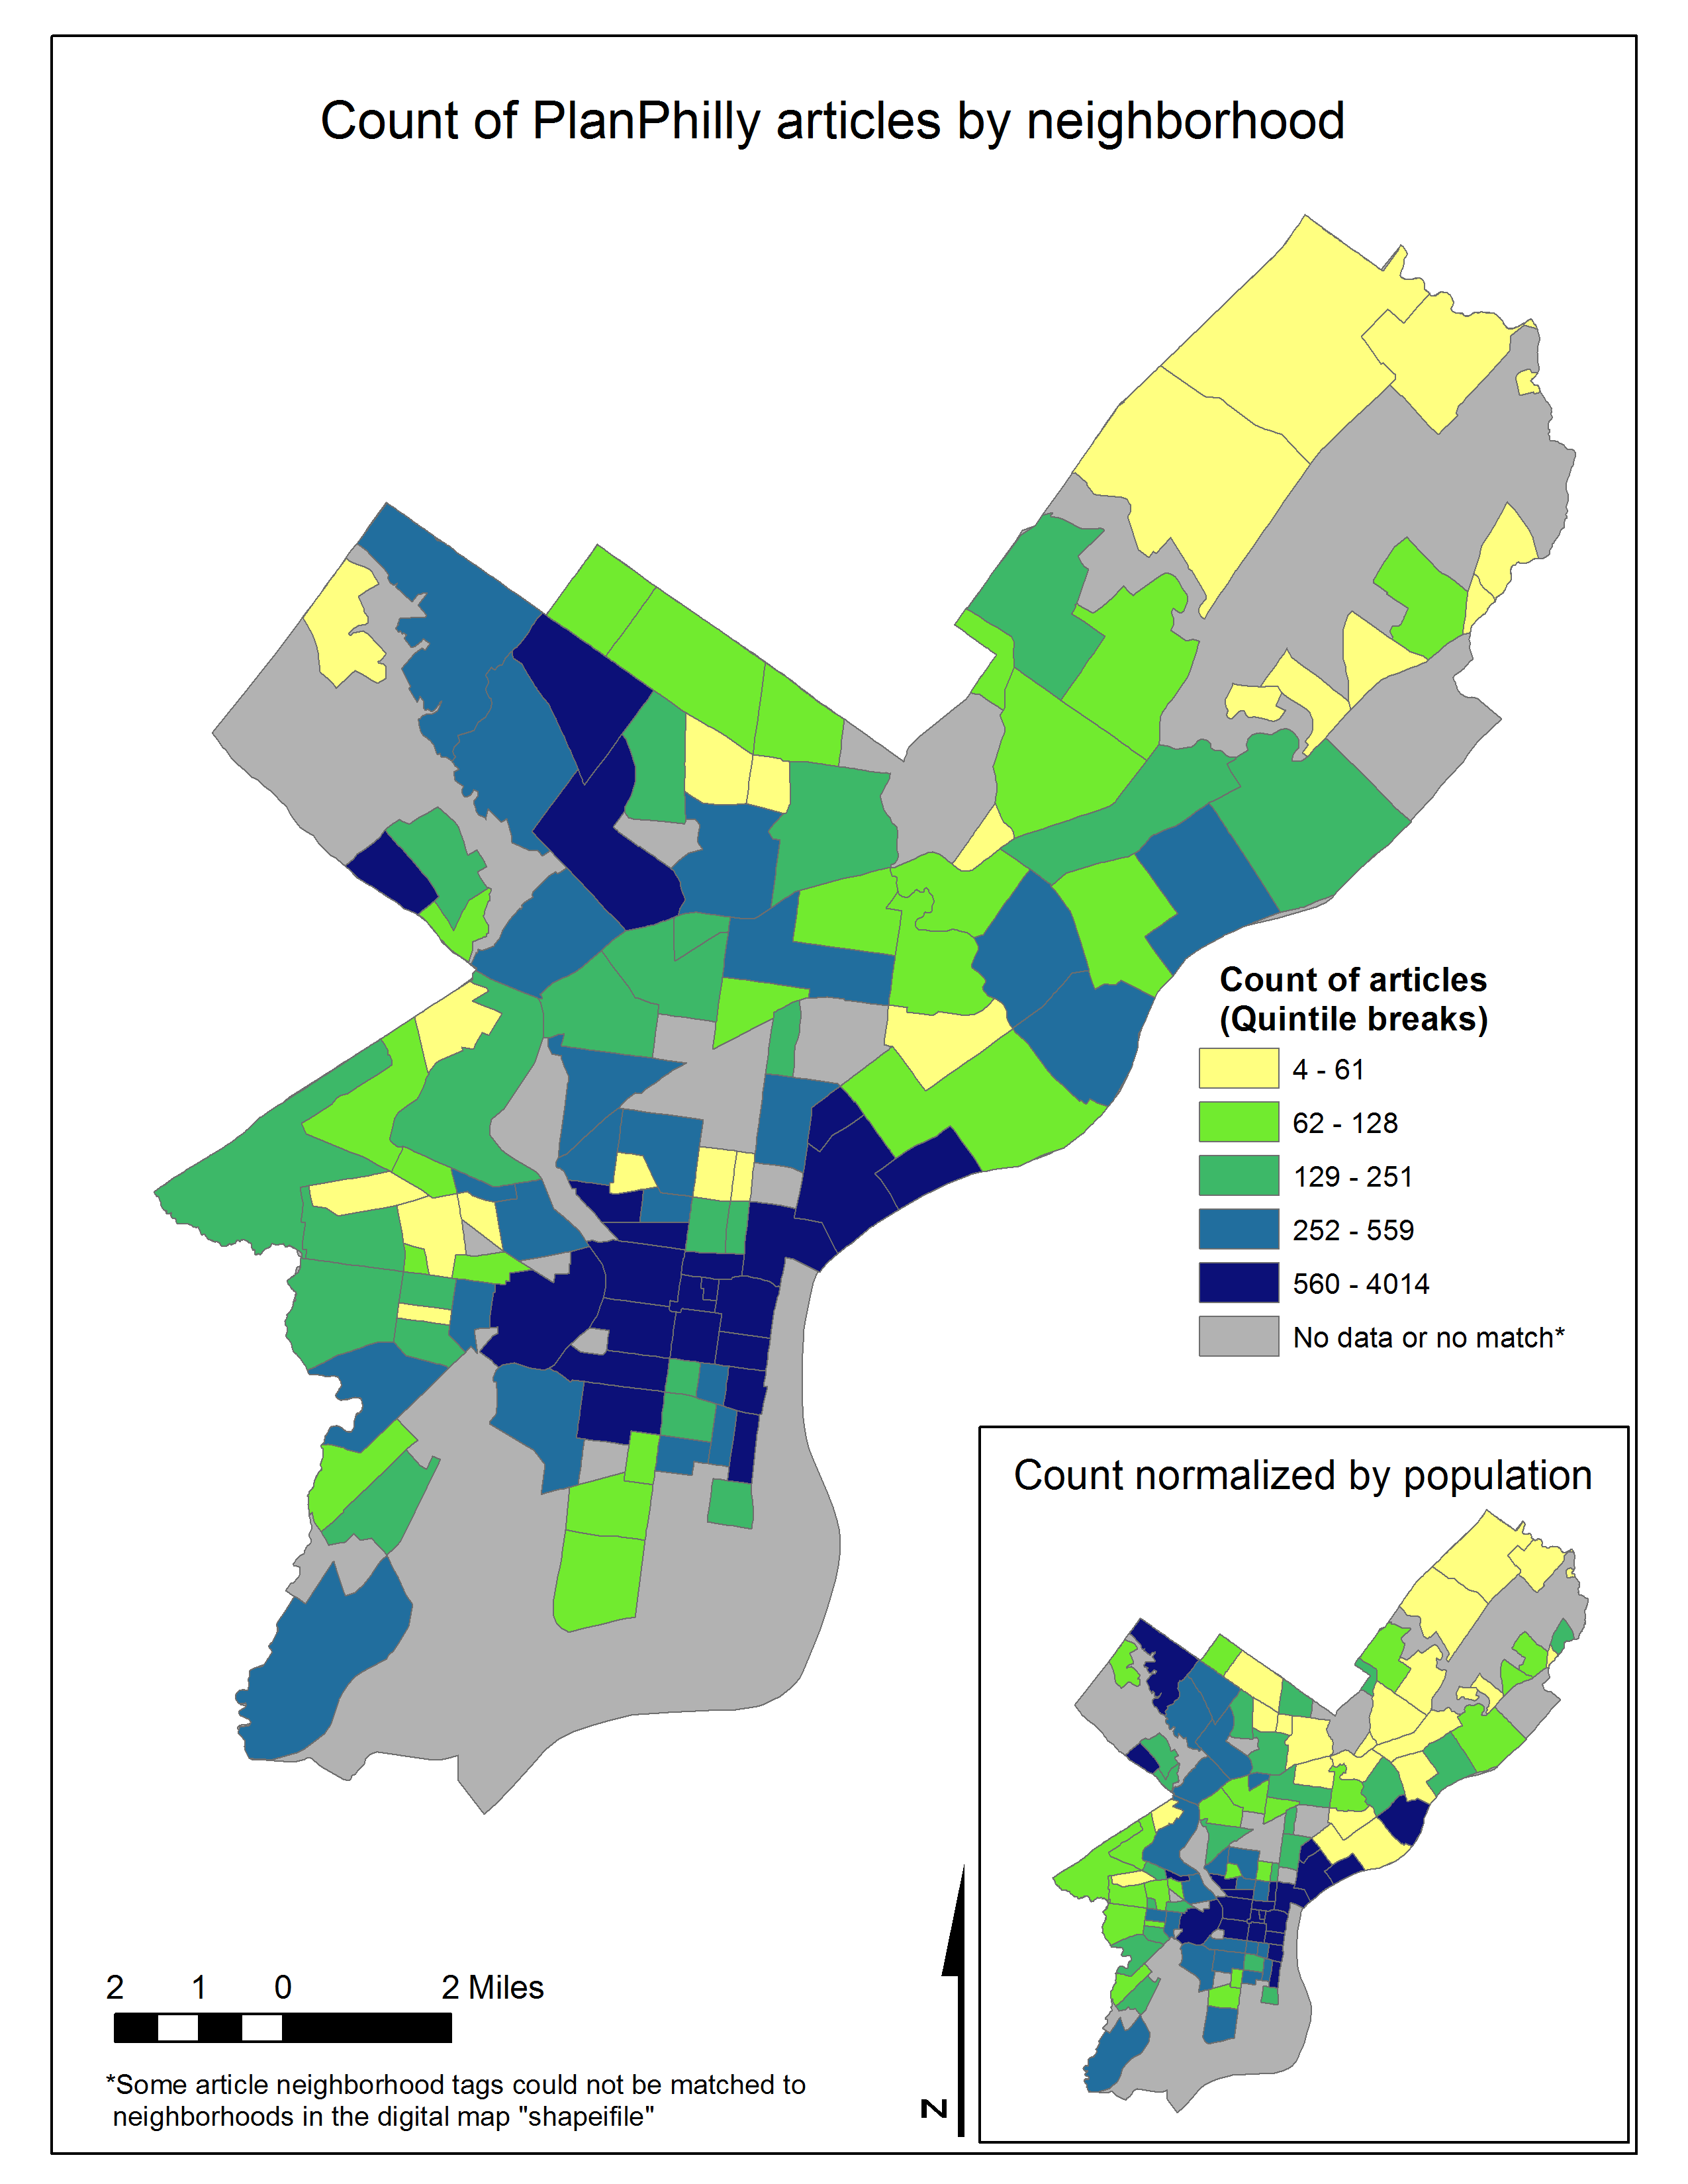
Once the matching process is complete, we can begin to ask some interesting questions about which of these concerns are associated with each neighborhood.
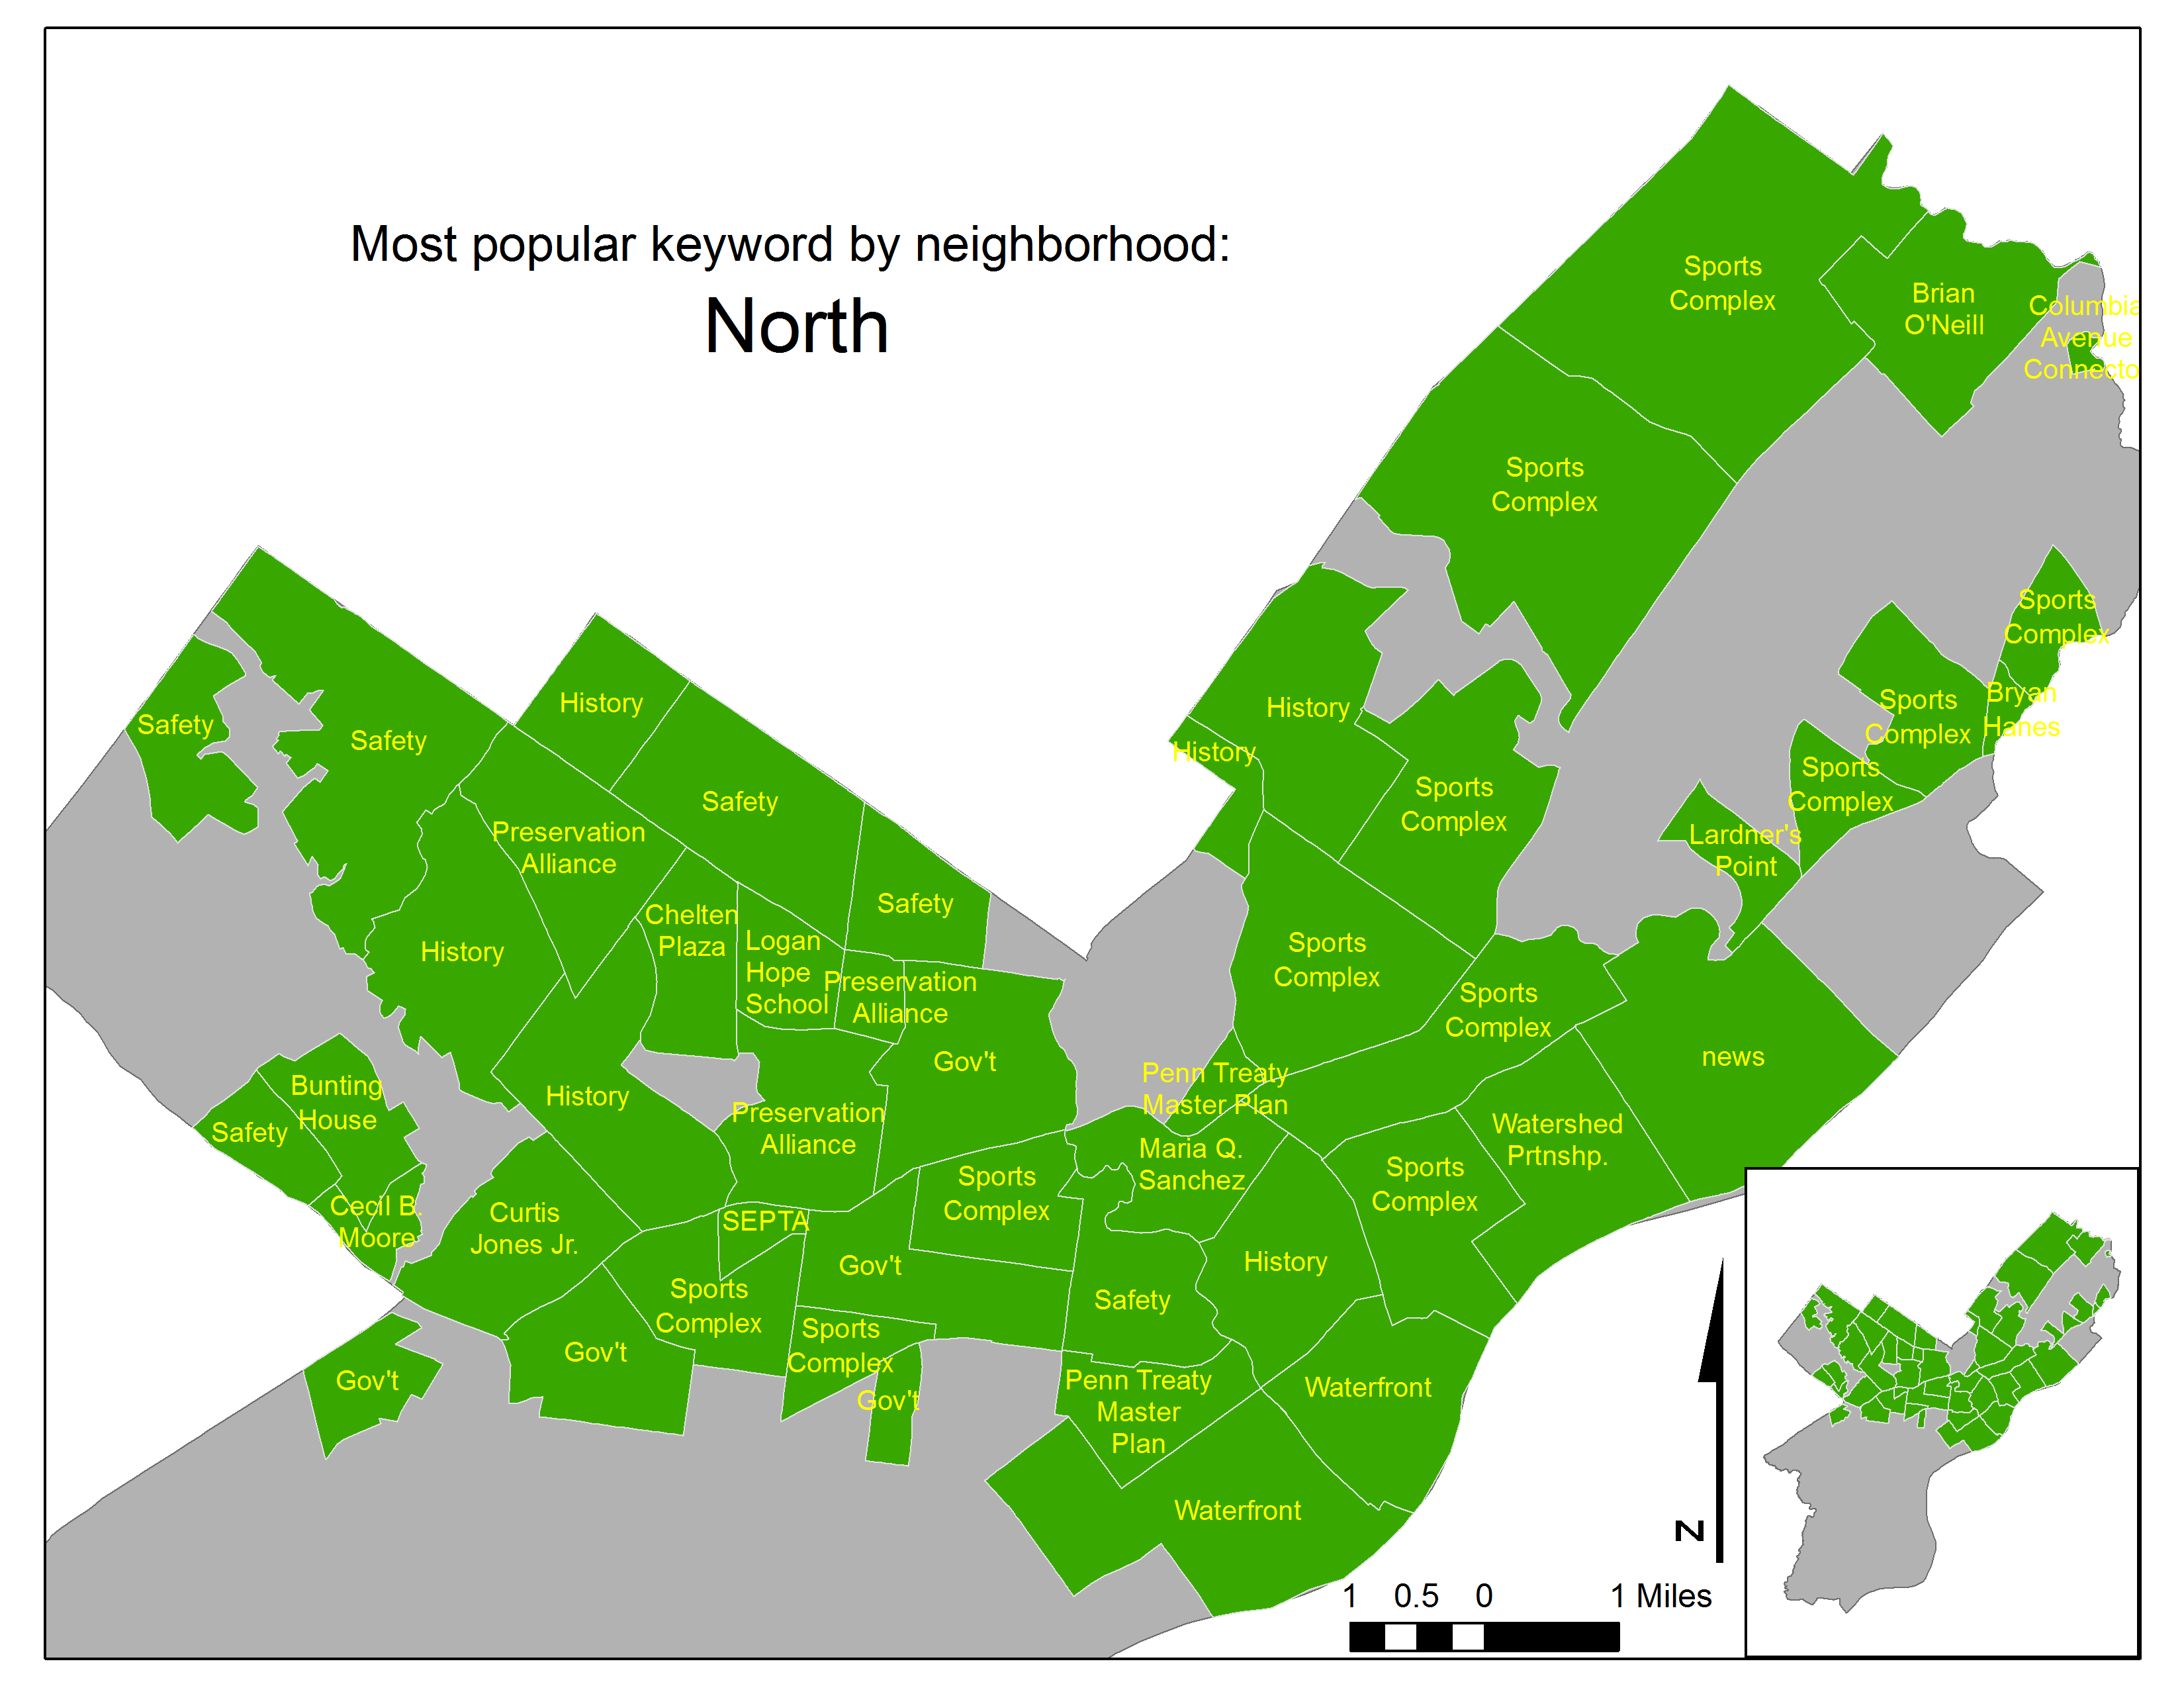
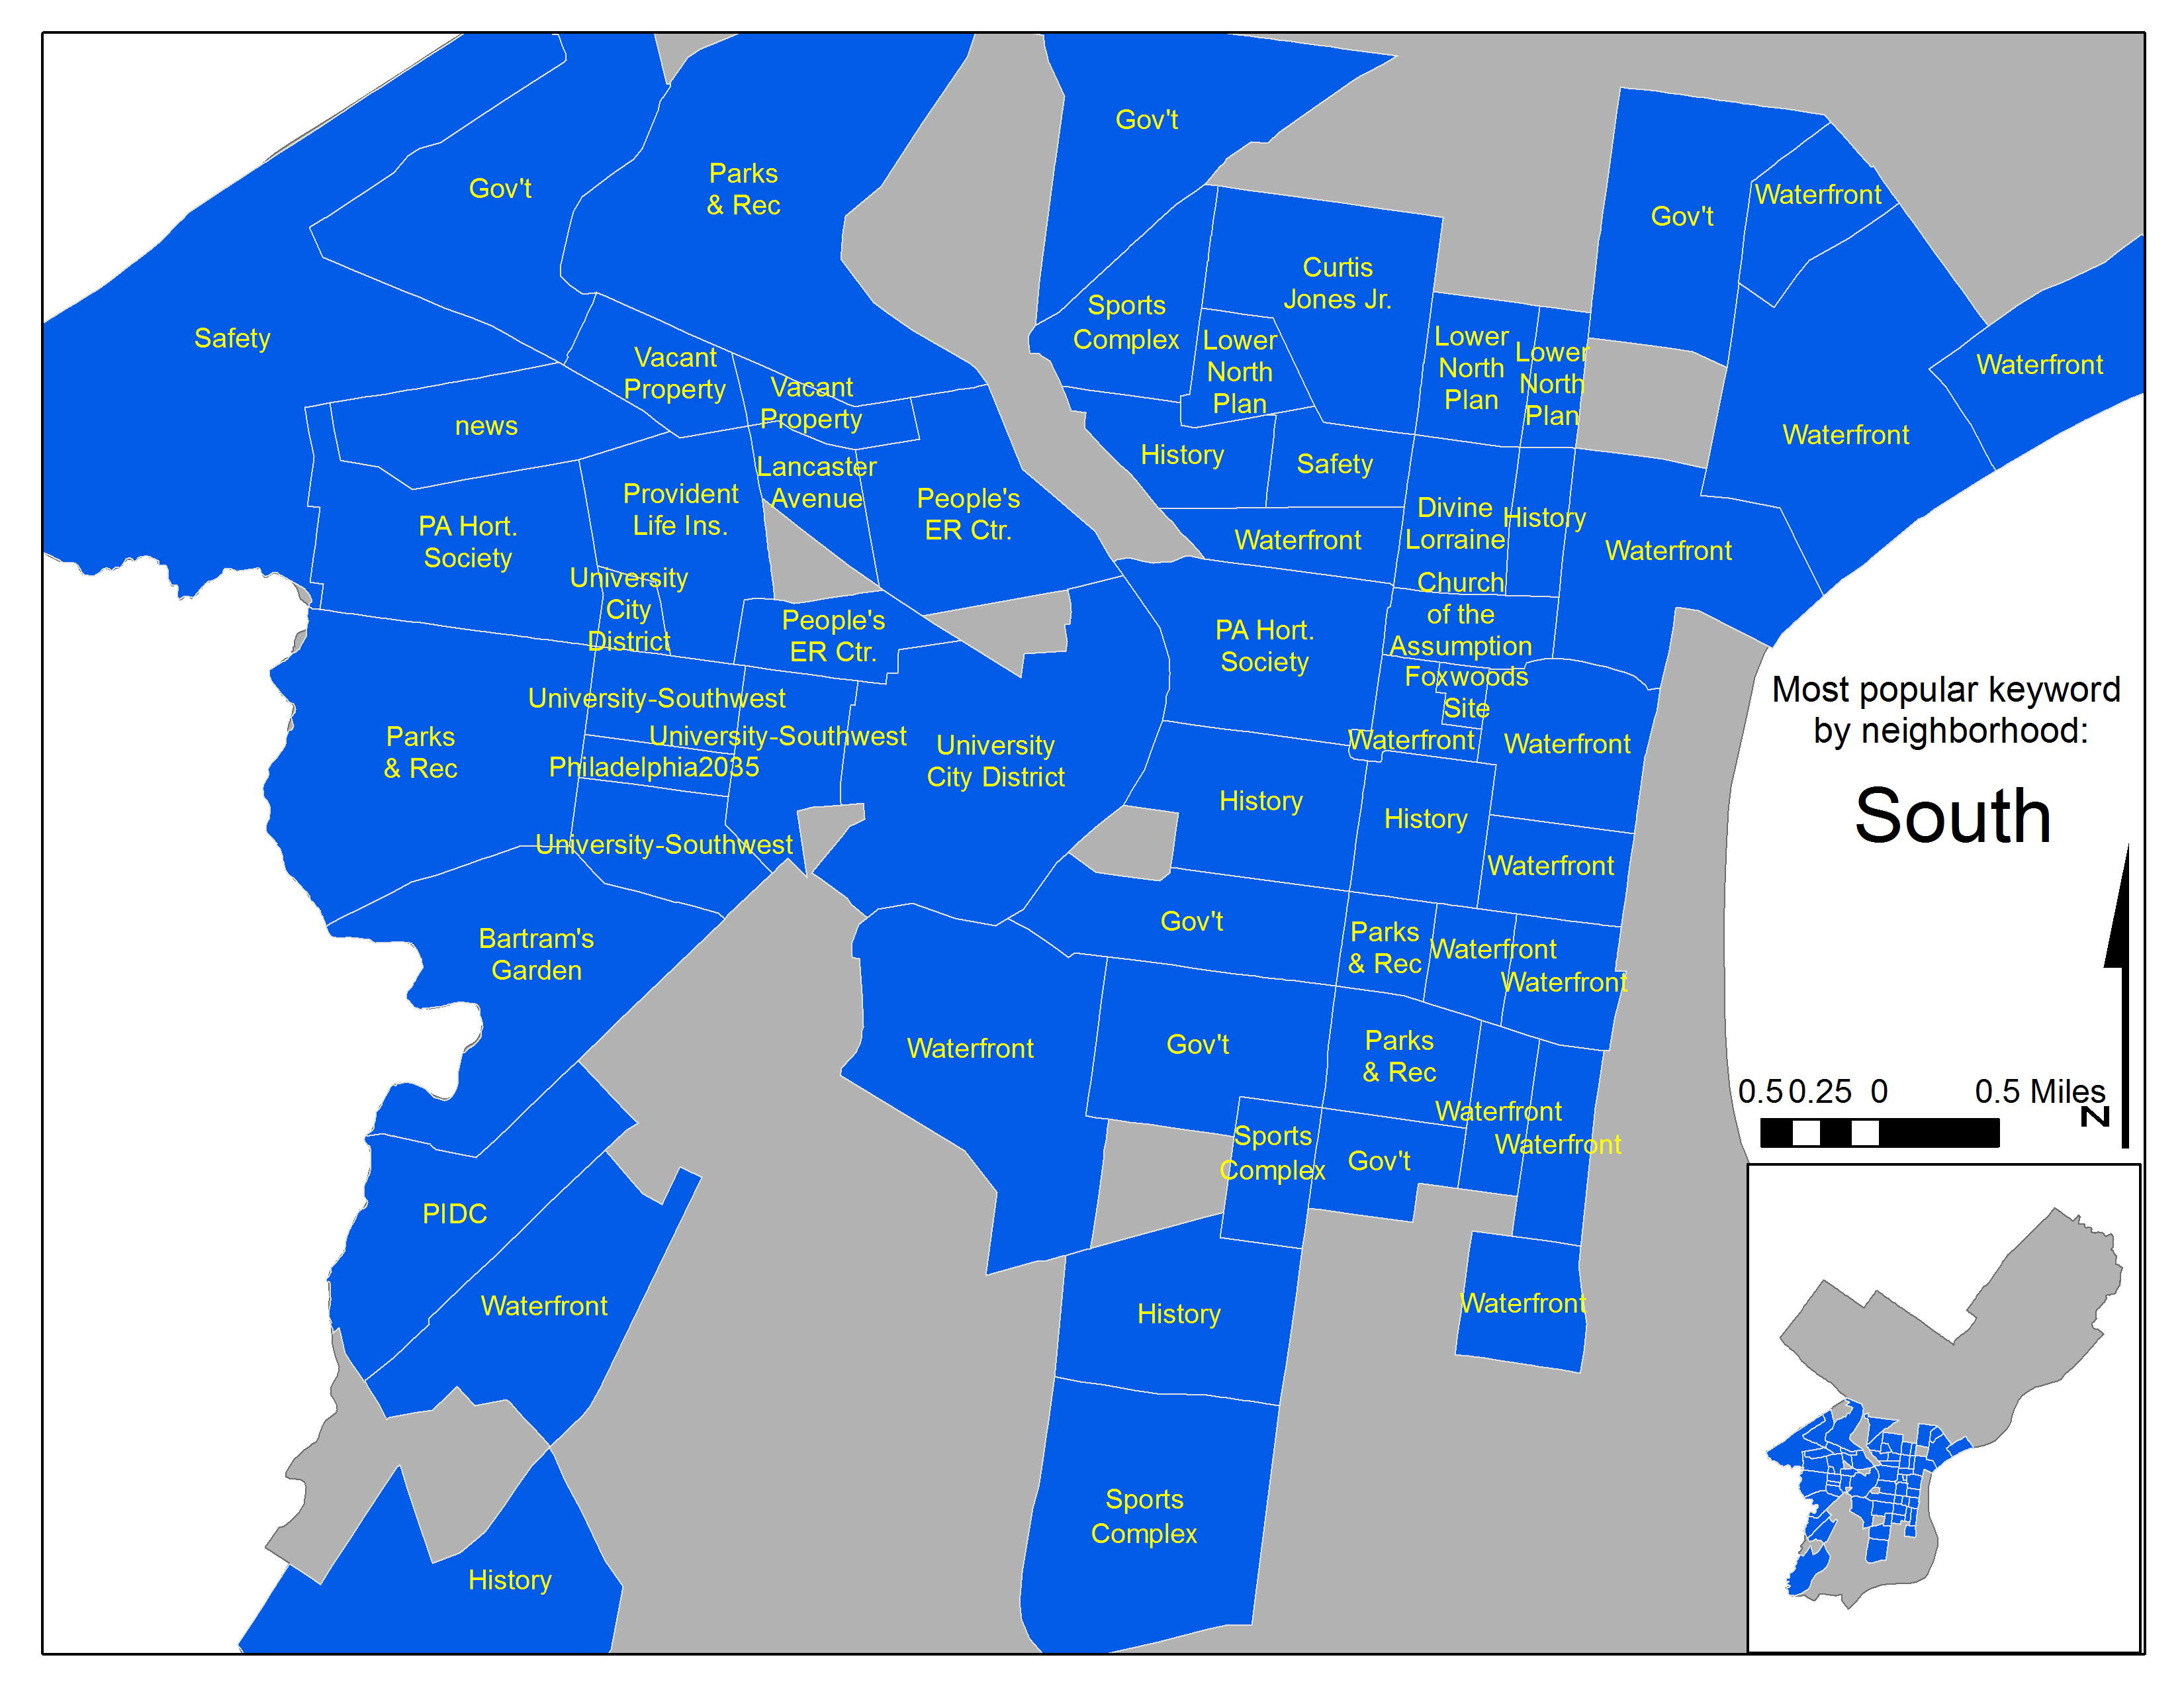
Figures 4 and 5 visualize the key planning themes for each neighborhood citywide using PlanPhilly keywords. Some of the most commonly used keywords are removed to showcase more local nuance. In addition, in order to create more coherent maps, some of the longer keywords are abbreviated.
Let’s look at two other metrics to help understand the emergence of different themes in the PlanPhilly data. The first is created by deconstructing all the PlanPhilly article titles into individual words and then calculating the number of times these words appear in articles over time. Think about this metric as describing the ‘supply’ of planning themes in PlanPhilly.
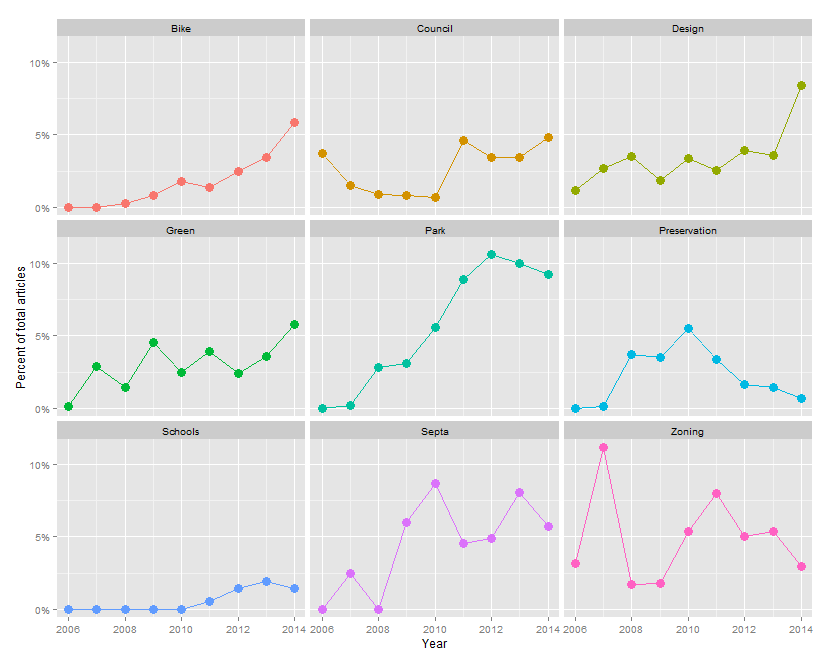
The second metric takes these same article titles and calculates the number of article views generated by a given title word. This metric can be thought of as one that reflects the ‘demand’ by readers for certain planning themes.
Both metrics are reported as a percentage of all articles. Figures 6 and 7 visualize the percentage of articles and article views respectively, for a given title word over time.
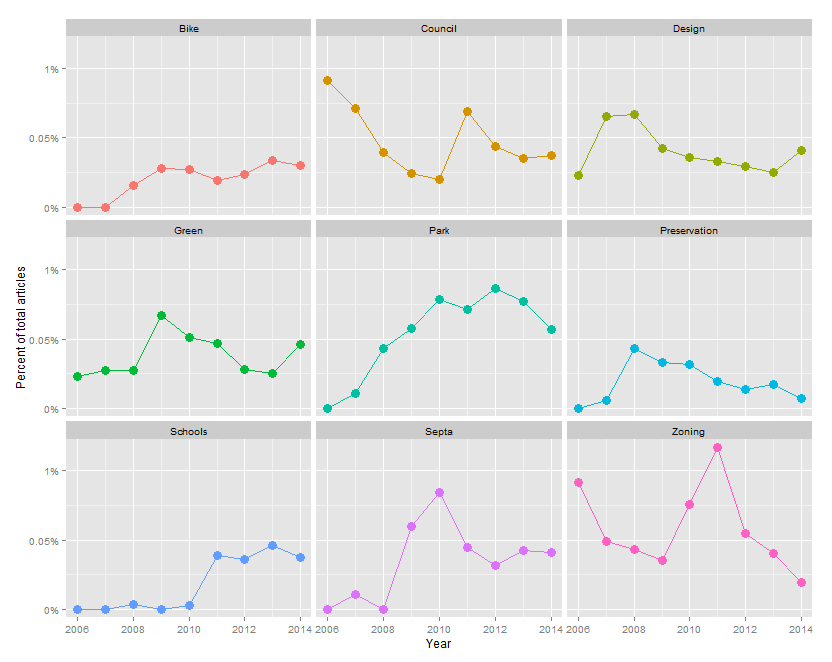
Prior to this analysis, PlanPhilly’s editorial staff had no way to tell if the themes they were covering (Figure 3) were actually in line with the themes that readers actively clicked on (Figure 4).
The expectation is that article views should trend directly with the number of articles published about a given theme.
This is the case for most of the above examples with a couple notable exceptions. While the number of written articles featuring the word “bike” in the title has remained steady since 2006, the number of views for these articles has grown exponentially since that time.
A recent report from the Bicycle Coalition of Greater Philadelphia echoes this trend, suggesting “an undeniable growth” in the number of bike riders citywide.
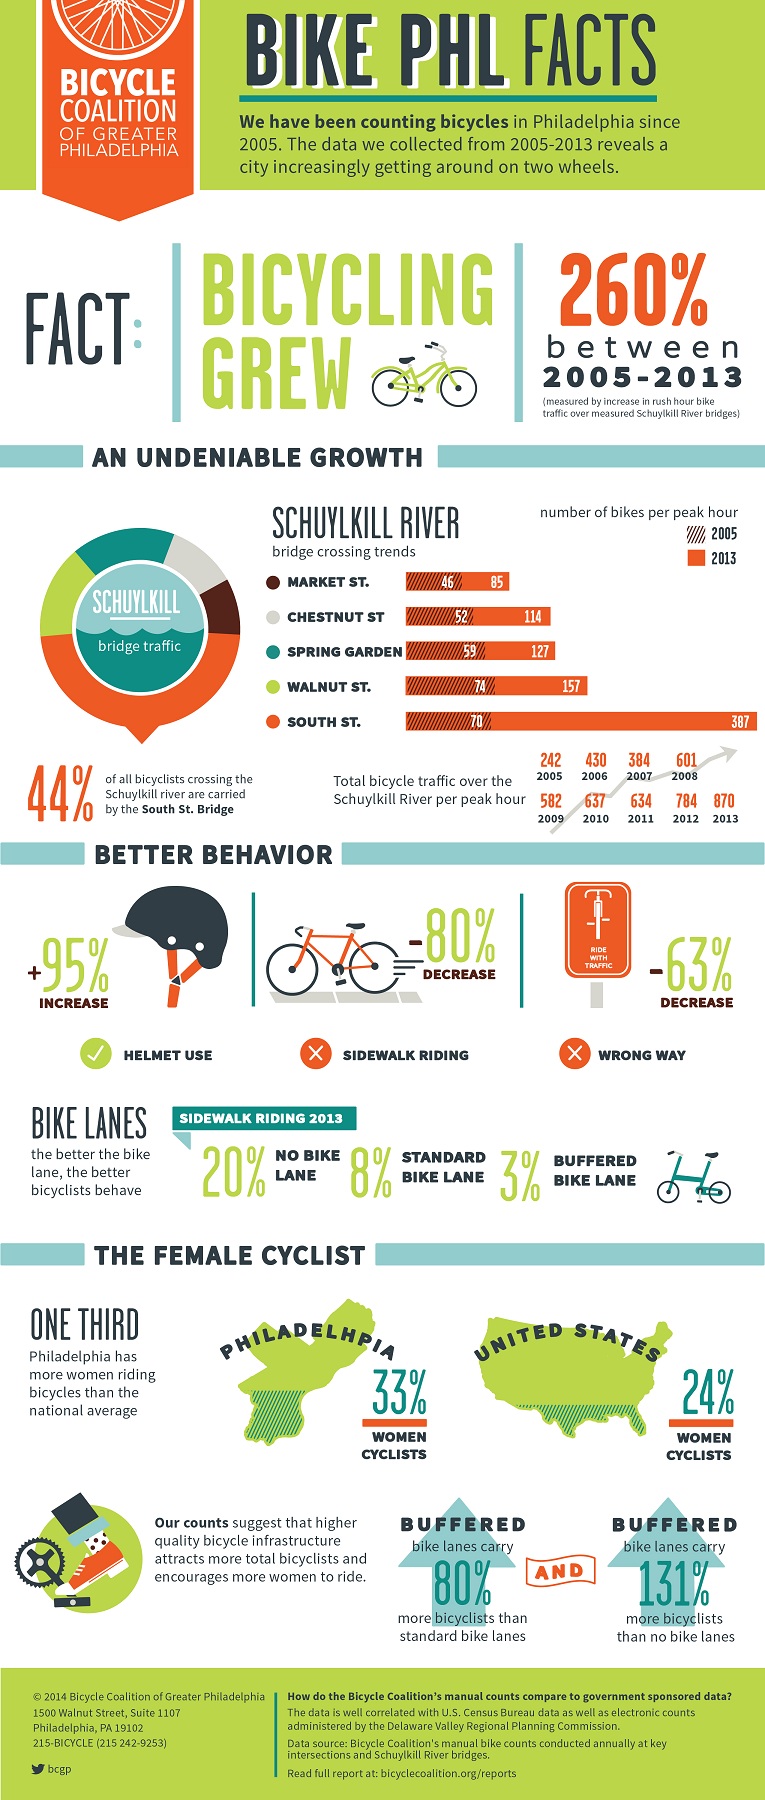
I found a similar trend in my analysis of article data for the more nationally focused Planetizen. It appears in Philadelphia as elsewhere, the mid 2000’s marked a collective shift in how we envision people and goods moving within cities.
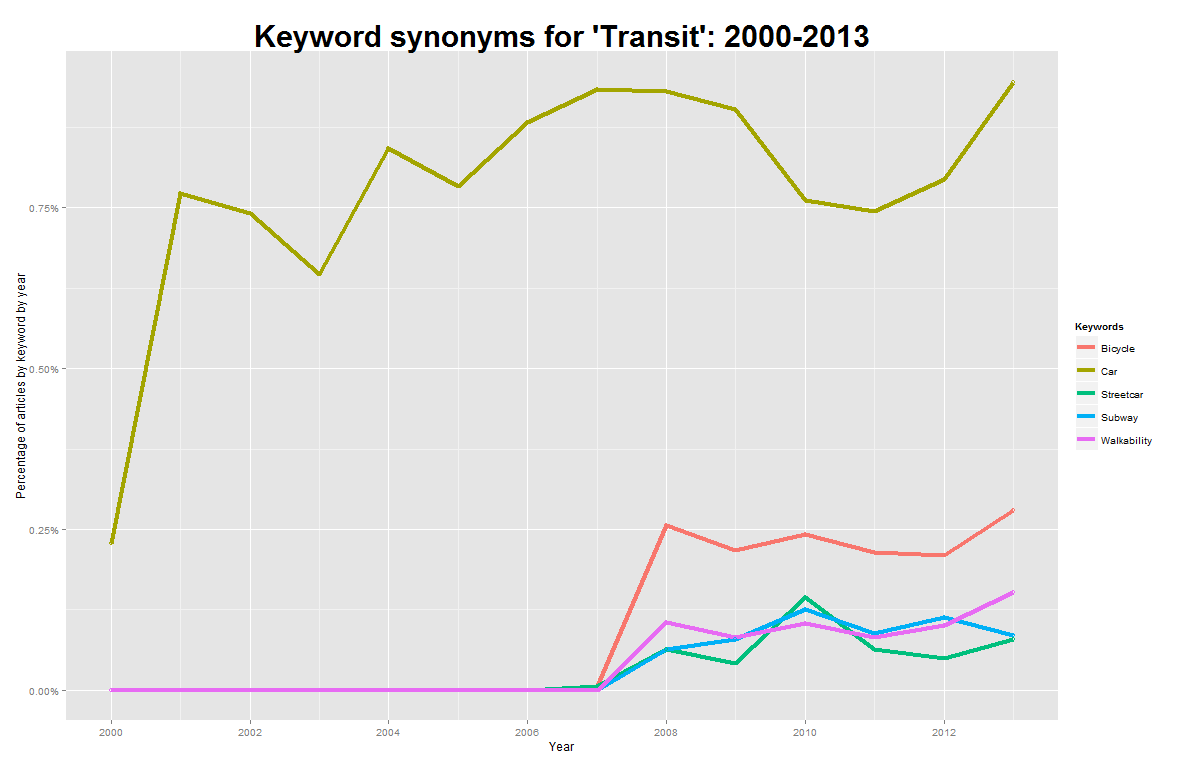
Finally, let’s take a look at two issues that PlanPhilly devoted a great deal of attention to – casinos and the waterfront. PlanPhilly’s initial catalyst was its coverage of the Central Delaware revitalization planning process, which as shown in Figures 8 and 9, attracted significant attention from both its writers and its readership respectively.
In 2006, PlanPhilly’s first year, nearly 20% of its total article views were driven by articles with the word “Waterfront” in the title.
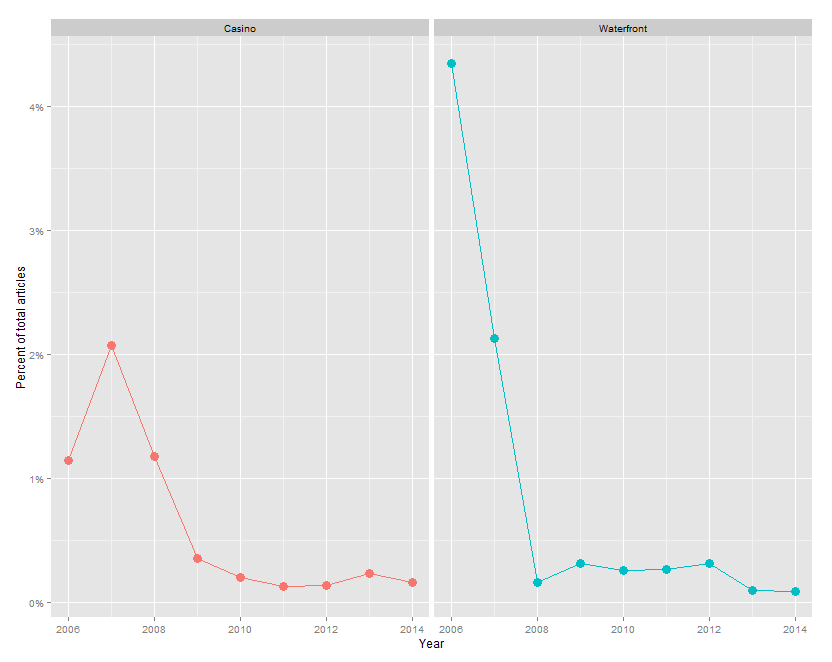
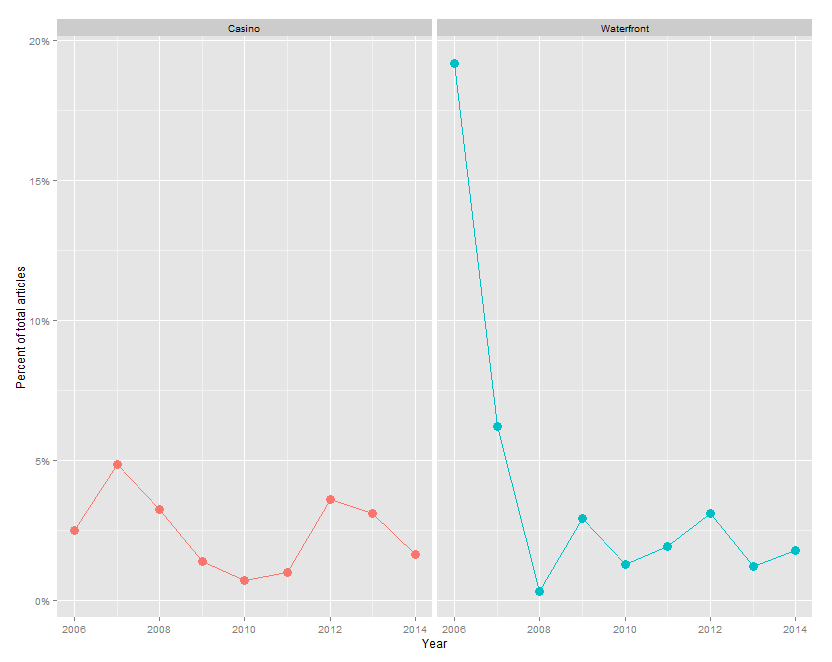
These trends in particular, demonstrate why PlanPhilly provides such an important public service. Waterfront revitalization is still an important issue, but there are so many others, and these data show that as one issue wanes, others like ‘Septa’, ‘Zoning’ and ‘Historic Preservation’ emerge in its place.
The evolution of PlanPhilly’s coverage is a reflection of how diverse and lively the planning and public policy discourse is in Philadelphia. Its organizational footprint allows it to be nimble and to cover what some might misconstrue as the day to day doldrums of city government. This notion is false.
When taken in aggregate and as a developing narrative, these accounts give readers unprecedented insights into the planning process from conception, to public comment, politicization and finally enactment.
New ideas in planning are having a transformative effect on our City, its many neighborhoods and the people who live within. PlanPhilly describes these innovations, providing us with both a historical account of where we’ve been and predictive almanac for where we’re going.
Ken Steif is a Doctoral Candidate in the City & Regional Planning Program at the University of Pennsylvania where he studies housing and neighborhood change. He also consults and teaches courses in GIS and spatial/statistical analysis. You can follow him on Twitter @KenSteif.
WHYY is your source for fact-based, in-depth journalism and information. As a nonprofit organization, we rely on financial support from readers like you. Please give today.
Brought to you by PlanPhilly

PlanPhilly
In-depth, original reporting on housing, transportation, and development.

Thousands of West Philly tenants remain in limbo as city considers saving 925 affordable rentals
The city missed its exclusive window to bid on the homes, opening the door to outside buyers and possible displacement.
21 hours ago
Listen 1:12
Backyard homes and basement apartments could become easier to build in Pa. Here’s why
Accessory dwelling units would help close the gap of affordable rentals, supporters say.
2 weeks ago
Listen 1:19
A $425M revamp: Bartram Village in Southwest Philly will be replaced with 500+ affordable rentals
An emergency declaration cleared the way for the site’s 44 aging, vacant homes to be demolished.
3 weeks ago
Listen 0:56