Deadly streets: mapping road fatalities
We talk a lot about creating complete streets and providing everyone – pedestrians, cyclists, and motorists – with safer spaces to move through the city. But where are Philly’s streets the most deadly and for whom?
ITO created a map of road fatalities in America from 2001-2009, allowing us to visualize a harrowing number of fatal accidents, using data from the Fatality Analysis Reporting System of the National Highway Traffic Safety Administration.
Yes, it’s a depressing map, but click through the map below to see where Philadelphia’s deadly accidents are concentrated.
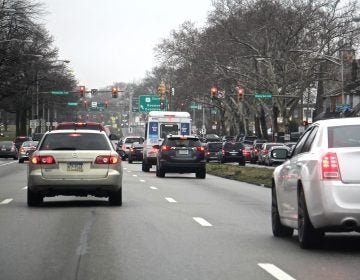
Of course, there are the usual suspects like the Roosevelt Boulevard, which is brutal for everyone. But interesting patterns emerge. From 2001-2209 Center City had more pedestrian fatalities than other types, likely because there is simply a higher concentration of pedestrians. Are there fewer fatal incidents on South Philly’s narrow streets because their scale slows traffic speeds? What patterns do you see?
WHYY is your source for fact-based, in-depth journalism and information. As a nonprofit organization, we rely on financial support from readers like you. Please give today.


