

Can we trust the Philadelphia District’s yardstick for school quality?
Listen

Philadelphia schools superintendent William Hite proposed converting three elementary schools into charters in October 2015. Each school had low test scores and declining enrollment, including Wister Elementary, around which the debate grew especially fiery. Hite is pictured at a School Reform Commission meeting shortly after making his proposal. (Bastiaan Slabbers for WHYY)
There are many reasons to be wary about relying too heavily on the School District of Philadelphia’s main tool for measuring school quality – especially when it comes to making high-stakes decisions about closures, staffing shake-ups and charter conversions.
Presented with a NewsWorks analysis of the publically available results of the first three years of the School Progress Report, top district officials acknowledged that the tool can not be used reliably to evaluate the effectiveness of schools over time.
Because of the way the district has manipulated the inner-workings of SPR each year, leaders say reports should be considered standalone snapshots in time.
Reading the reports, though – which showcase outcomes over years – can leave the public with a much different impression.
Take Ellwood Elementary School in Oak Lane as an example. Judging by this year’s report, the school seems to be on an upward trajectory. Ellwood gets especially high marks for student “progress” – which the SPR weights most heavily in calculating an overall score.
In each of three categories – “achievement,” “progress” and “climate” – schools can receive four designations: “model,” “reinforce,” “watch,” “intervene.”
As the screenshot below shows, Ellwood is now considered “reinforce” in progress – up from the yellow dot representing “watch” in the previous year.
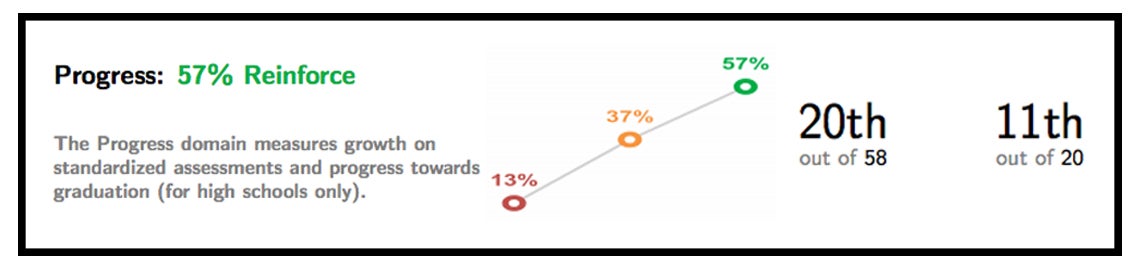
But, according to district officials, that is an essentially meaningless distinction and misleading visual representation. Ellwood only moved up a progress tier because the district recalibrated its scoring system between 2013-14 and 2014-15, easing expectations.
In technical statistical terms: the “floors” and “targets” were lowered.
Does that recalibration negate the entire idea of calculating “progress” this year?
District officials say, ‘no.’ Meaning that for some schools, they say the appearance of “progress” is a fiction, while for others, it’s a reality.
“You’d have to unpack it by going into the specific metrics,” said Jura Chung, the district’s chief performance officer and architect of the SPR.
The idea is further complicated because the state tests taken by elementary and middle-school students changed dramatically between 2013-14 and 2014-15.
All of this has come to a head in the much anticipated vote on whether Wister elementary in Germantown should be converted into a neighborhood-based charter school run by Mastery.
One of the essential questions in that debate has been: is the progress shown by Wister in the 2014-15 SPR report real? Is it, like Ellwood, a trick of technical tinkering? Or, possibly, something related to the test change?
More on that later.
In the lead-up to Thursday’s School Reform Commission meeting – one which will feature a series of hotly debated, high-stakes votes, including Wister – these are some of the oddities in this year’s SPR reports that should be considered closely.
The bottom-line question is: How much stock should decision makers put into SPR in a year when the metric was revised and the assessments were dramatically altered?
Some background
SPR was implemented three years ago on the heels of significant budget cuts in Philadelphia.
Leaders wanted to create an accountability tool that would highlight meaningful progress and not shame and blame the schools that serve the most needy, at-risk student populations.
The state’s School Performance Profile metric gives equal weight to achievement and growth, and analyses consistently show that performance on SPP correlates strongly with student poverty.
Pivoting away from that model, SPR weights “progress” most heavily. And it derives those growth scores from the state’s value-added metric, PVAAS – which judges schools based on how well students perform on state tests compared to their results the prior year in relation to the rest of the state.
PVAAS results show very little correlation to student poverty in reading and math in non-high schools.
“It’s important for us to understand who’s growing children, because otherwise, if we just do it on achievement then it paints a very different picture,” said Superintendent William Hite. “We need to acknowledge where children are growing.”
But like most metrics which purport to evaluate school quality, the SPR has its share of critics – especially because of the year-to-year volatility of PVAAS.
The District has increased that volatility by adjusting the inner-workings of the metric in ways such as described above.
As a result, as the graph below shows, the most consistent thing about school “progress” as captured by SPR is inconsistency.
Of the 170 non-high schools that participated in SPR since its inception, the largest chunk moved into a different “progress” tier each year – both up and down.
(Here you can see an interactive spreadsheet of non-high schools that participated in SPR since its inception. Only district schools participated in year one.)
This volatility is what drove the district to give growth less emphasis, changing it from 50 percent of a school’s overall score to 40 percent in 2014-15.
But looking at the three years of SPR “progress” data, a question is begged:
If SPR tells us that, for instance, John Hancock elementary has progress scores that moved from “reinforce” down to “intervene” before surging up to “model,” is it telling us anything meaningful about what’s going on inside the school?
For School Reform Commissioner Bill Green, the inconsistency calls into question the ways the district has tinkered with the SPR.
“It’s not fair to the schools not to lock it down at a certain point,” said Green. “It’s hard on decision makers and policy makers when you have a score, but the underlying reason for that score is shifting.”
Highlighting a rarely seen rift between the SRC and the Hite administration, Jura Chung pushed back against Green’s recommendation.
“It’s a tradeoff, right? Do I keep the tool constant for the sake of longitudinal analysis?” she asked. “Or do I enhance the tool because I think these changes are making it better and giving us a better snapshot of school quality? I don’t want to give up one for the other, necessarily. I can commit to minimizing the changes. I can’t guarantee that we’ll have no changes from here on out.”
Chung adds that she shares much more nuance and context with decision makers that does not appear in the publicly available reports.
‘It’s a factor, I don’t know how much’
There are other questions about the reliability of SPR growth data, specifically based on recent changes on Pennsylvania’s state tests.
Again, some background is needed:
The state PSSA tests that elementary and middle schools take became much harder in 2014-15, and proficiency rates subsequently declined dramatically across the state.
The most staggering declines came on the math test.
Because of this, the state decided not to publish the results of its school quality metric (SPP) in Fall 2015 as it had in previous years.
The state did still publish its PVAAS growth data, arguing that the added rigor of the test would not affect growth scores because the PVAAS metric is relative based on how all students score.
If all students see score declines, PVAAS can still report growth by comparing expectations against comparative successes.
In theory, the Pennsylvania Department of Education argues, even if the test completely changes, it can still measure growth over time by comparing where schools fall along the two distribution curves in relation to the rest of the Commonwealth’s public schools.
Some question the logic of making judgements about school quality in a year when the assessments and expectations dramatically shifted.
Chung, who considers 2014-15 the “new baseline,” defends the district’s decision to move forward with SPR.
“A new harder test could have influenced the growth metric, but it doesn’t invalidate the growth metric,” she said. “It’s a factor. I don’t know how much of a factor it was.”
In this regard, analysis of the data raises some important questions.
In theory, proficiency scores should not correlate with growth scores. All schools should have the same chance of showing progress on state tests – no matter if they’ve historically performed at the very top or very bottom of the scale.
That’s the entire conceit of PVAAS, and to a large degree SPR.
But there are trends in the data in Philadelphia that seem to call that into question.
Of all the schools with above average math proficiency scores in 2012-13, 62 percent had positive math growth scores on PVAAS in the following year.
Of all the schools with above average math proficiency scores in 2013-14, 46 percent had positive math growth scores on PVAAS in the following year when the more rigorous test was implemented.
So, the majority of better performing schools in 2012-13 posted positive growth scores the following year. And the reverse was true for better performing schools in 2013-14.
A similar trend appears when looking at schools with below average proficiency.
The majority of worse performing schools in math in 2012-13 posted negative growth in math scores the following year.
And, again, for lower performers in 2013-14, the reverse was true: a sizable majority of those schools posted positive math growth scores in 2014-15 after the test changed.
So the question becomes: What does it mean that trends flip-flopped after the implementation of the new, more rigorous test?
Data chaos
There could be several reasons for this result, and researchers warned against making definitive judgements based on this analysis without performing a much more exhaustive study.
In individual cases, the change could be attributed to any one of the multitude of complex inputs and factors that make schools what they are.
But it may lend credence to criticisms levied against this year’s SPR by the city’s largest chain of charter schools.
Mastery Charter Schools did not fare well on SPR in 2014-15, specifically on “progress” ratings.
But Mastery believes poor performance on SPR progress this year says more about the measuring tool itself than it does about the quality of its schools.
“What we have here is a relatively new metric in a time of data chaos. This situation isn’t that well tested. And so the results were a bit unpredictable,” said Peter Lee, Mastery’s deputy chief operations officer. “I think the usage of the SPR to make a high-stakes decision this year is not really a good policy choice.”
In many cases, Mastery’s progress scores were so poor that they pulled overall school rankings down by two whole tiers in some cases.
“We expect this to be a one year blip,” said Lee. “You’ll see a lot of change this year, and then a lot of change next year sort of back to where higher performing schools are higher performing again. And then things should probably level out again.”
Lee attributes that “blip” to the idea that the added rigor of the 2014-15 test inordinately made previously high performing schools look worse on growth measures and low performing schools look better.
“Because on the new test the bar is higher, almost every school fell in relation to the new test versus the old test. So what it did, is it disproportionately affected schools that were higher in the old test because they had further to fall,” said Lee.
The school district rejects this logic.
A closer look at the fringes of the data again raises questions.
Of the 219 schools that participated in the SPR in both 2013-14 and 2014-15, the average school dropped 32 proficiency points on the new, much more difficult state math test.
If you isolate the 46 schools that had less than a 32 percent proficiency rate in math in 2013-14 – meaning those that mathematically couldn’t fall as far as the average – 65 percent had positive growth scores in math in 2014-15.
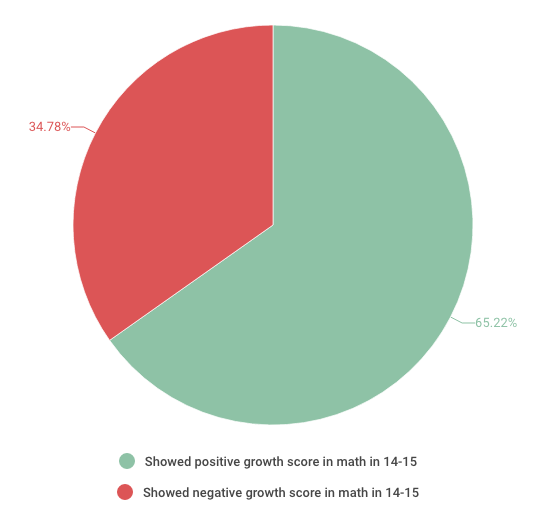
Conversely, of the 46 schools with the highest 2013-14 math proficiency rates, 54 percent had negative growth scores in math in 2014-15.
While the former point may help validate Mastery’s position, the latter may undermine it. Of schools with the highest proficiency rates, the difference between positive and negative growth was roughly split.
That’s the sort of non-correlation between proficiency and growth one is told to expect from PVAAS.
Here, to Mastery’s critics, its drop in progress may be explained by another phenomenon.
“If schools are preparing kids to do well on the test rather than just doing regular teaching and learning, changing the test will result in scores dropping dramatically, which will impact your growth scores,” said Ed Fuller, Director of Penn State University’s Center for Evaluation and Education Policy Analysis. “If all you’re doing is test prep, and they change the test, yeah, you’re not going to do very well on the new test.”
The Wister question
Mastery disagrees with that assessment. Prior to 2014-15, though, it acknowledges that its curriculum was rooted in helping students at low-performing schools build “foundational” knowledge.
Mastery revised its curriculum model in 2014-15 in hopes of better helping its students persist through college. The new model, like the new Common Core aligned state math test, prizes critical thinking skills most highly.
“It’s going to take a little time to perfect that model,” said Mastery CEO Scott Gordon. “It was a big adjustment for students. It was a big adjustment for staff, for families. We think it’s the right thing to do. It’s what a great school district does.”
Taken together, though, these points encapsulate much of the debate over giving Mastery control of Wister elementary through the renaissance process.
And, as usual, each side of the debate selectively chooses data points to suit its interests.
Opponents of the conversion glide over any questions about the veracity of the SPR, where this year Wister appears on the upswing in “progress” and many of Mastery’s schools seem on the skids. Also glossed over is Mastery’s very sunny track record prior to the most recent data.
Proponents of the conversion, minimize this year’s negative distinctions and emphasize the fact that only 3 percent of Wister’s students are proficient in math. Often omitted is the fact that six of Mastery’s schools now have students in the single digits in math proficiency as well.
Here you can view an interactive spreadsheet of the past two years of SPR, which features all district non-high schools and most charters.
Mixed messages
The District itself has been sending mixed messages on the matter. Superintendent Hite originally recommended Wister for conversion, but then reversed course mid year based on SPR growth scores.
Jura Chung says, yes, Wister’s growth is the genuine kind – not a technical aberration, as seen at Ellwood.
The District’s Charter School Office, though, is reading from a different playbook – one that doesn’t take SPR into account at all.
It recommends charter conversion even though the most recent SPR took Wister off of the “intervene” list and put five Mastery schools on it.
For another example of how SPR ratings are not the main predictor of intervention decisions, one only has to look at this year’s high-stakes recommendations.
There are 10 schools that have been consistently labelled “intervene” for both “progress” and “overall” in all three years of SPR.
Hite and the School Reform Commission are considering (or have already acted on) high stakes decisions at 9 schools this year. But only three of these are on the list of ten: Luis Munoz-Marin and Jay Cooke elementaries, and Beeber Middle School.
While that may frustrate the neighborhoods and educators connected to the other six schools, this phenomenon supports one of Jura Chung’s main points.
Even if there are reasons to be wary of SPR, the tool is just “one piece in a complex puzzle.”
“It’s both art and science,” said Chung. “Some of this is executive call at the end of the day.”
WHYY is your source for fact-based, in-depth journalism and information. As a nonprofit organization, we rely on financial support from readers like you. Please give today.

Rutgers University’s unionized faculty want administration to stop ‘unnecessary’ hiring freeze
The hiring freeze announcement comes as the unions have begun negotiating a new labor agreement.
3 days ago

Thomas Herlihy raped the girl in Atlantic City in 2016 and, authorities say, sexually abused her through 2018 in Delaware.
4 days ago
Listen 2:01
Jacqueline S. Mattis, dean of the School of Arts and Sciences, made more than $100,000 for hosting writing retreats, some of which took place in Jamaica.
6 days ago
Listen 0:54