Parsing income-based definitions of gentrification

What is the opposite of gentrification?
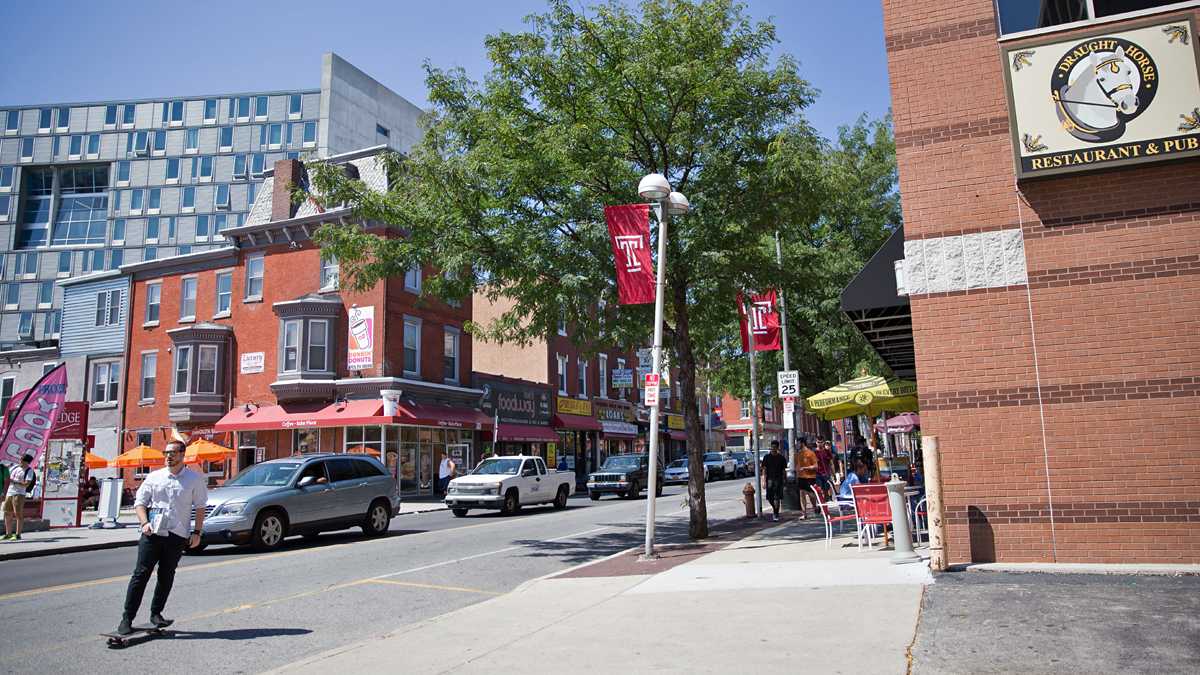
By one definition, it might be happening in a small rectangular census tract in North Philadelphia, which runs from Broad to 19th streets from Montgomery to Jefferson streets. This chunk of North Philadelphia has had a storied last half-century — from the Columbia Avenue Riots to the flight of working-class Jewish merchants, from the erasure of an African-American jazz scene to, in recent years, the frenetic expansion of off-campus housing catering to Temple University students.
This is the same census tract that contains the Edge at Avenue North, an 800-unit student apartment complex at the corner of Broad Street and Cecil B. Moore Ave. Walk down any of the surrounding blocks and you’ll find “FOR RENT” signs unmistakably geared towards students for the upcoming fall semester. The buildings are branded with names like “Temple Villas” and “North Philly Living.”
The chapters that make up Temple University’s neighborhood gentrification story are well documented. But based on the definition of gentrification used by the Pew Charitable Trusts in a recent study, which used change in median household income between 2000 and 2014 as its measure, this area hasn’t gentrified at all.
In fact, this census tract ranked among the city’s least gentrifying quarters. It saw a 50 percent decline in household income throughout Pew’s timeframe, falling from its previously poor median of $23,304 to a deeply poor $11,578. This was the fifth largest decline out of the city’s 372 tracts.
Pew’s report says that a census tract only gentrified if, in 2000, it had a median income that was less than 80 percent of “area median income,” or the level at which residents qualify for certain federal housing assistance. In the 14-year window of the study, Pew says gentrification only happened in tracts that saw an increase in the median income of 10 percent or more, and only if the final median income was higher than the city’s average of $37,460. So in short, gentrification happened when a pretty poor neighborhood experienced a relative increase in wealth.
But when one of the supposedly least gentrifying areas has been the subject of its own gentrification studies, does the income-based definition prove suitable?
Temple isn’t an outlier. Another census tract in Powelton Village, which encompasses 30th Street Station, also ranked in the 10 tracts that hemorrhaged the most income throughout Pew’s study period. Like the tract near Temple, Powelton Village has seen continued demand for student housing for nearby Drexel University.
The reason for these university-area outliers is obvious enough. By Pew’s definition, what’s happening in the Temple and Drexel areas doesn’t count as gentrification because student residents report little to no income.
“Both of those two areas are near universities. The report shows that in these areas near universities, largely driven by student residents who do not have high incomes themselves, but may have access to family wealth and other sources of money. However, there is no way to measure that,” Larry Eichel, the director Pew’s Philadelphia research initiative, wrote PlanPhilly in an email.
Pew’s report focused on pinpointing the city’s most gentrified neighborhoods: former working-class African-American neighborhoods like Graduate Hospital, former industrial neighborhoods like Northern Liberties, as well as mixed-income, mostly white neighborhoods like Passyunk Square, Pennsport, and Roxborough.
It then measured these neighborhoods for demographic changes, and found that displacement was limited to just three census tracts in Graduate Hospital neighborhood. Between 2000 and 2014, the total black population for these three census tracts plummeted from 7,793 to 3,450, while the white population tripled from 2,156 to 7,007.
Looking at the Temple University area, however, census data shows similarly starting demographic changes.
There was a significant population boom west of Broad Street in roughly the same period as Pew’s study. In 2000, the census tract just west of Temple had a population of 2,238, which was 96 percent African American. Over the next decade, two large off-campus student-housing complexes opened their doors: Sydenham Commons in 2005, and the Edge in 2006. Smaller developments and apartment conversions swept through the surrounding blocks. And by 2010, census data shows that the population in this tract nearly doubled to 3,939 residents. There wasn’t a mass exodus of African American residents as in Graduate Hospital, but nonetheless, the area’s white population grew to make up roughly 50 percent of the population in 2010. Moreover, college-aged residents between the ages of 18 and 21 suddenly made up almost two-thirds (2,410) of the population.
Nearby census tracts also experienced population growth among college-aged residents in this period. Discussions of gentrification in the area have intensified around topics from rowdy college parties to racial tensions to the neighborhood’s very name. Two years ago, Google came under heat for geo-tagging this area “TempleTown” on Google Maps. Residents were outraged, and Google removed the name.
“It’s racist,” Christine Brown, who works with the nonprofit Beech Interplex at 15th and Cecil B. Moore, told WHYY at the time. “It’s a name that’s being used by developers.”
If this isn’t gentrification, then what is it?
Moreover, if this poor-on-paper student population drags down the area’s median income, what does this say about the economic status the neighborhood’s long-term residents? Financially, have they been hurt or hindered by the last decades of university-driven investment in their neighborhood?
Skeptics of gentrification across the city argue that household income is an uneven and awkward metric by which to measure the phenomenon. Nora Lichtash, the director of Women’s Community Revitalization Project, says this approach misses a crucial component of the debate — housing costs.
“In those neighborhoods, if you look at how quickly rents rose, that will give you a very different picture,” Lichtash said.
By 2014, long-time residents in the Temple area were reporting as high as “an 80 percent jump in rent” costs, although data on long-term rent changes has been inconsistent. In its report, the Pew research team is careful to note that gentrification can certainly occur in areas that didn’t experience income surges. But ultimately, Pew measured gentrification with data the experts felt was most reliable.
“There is no universally accepted definition of gentrification,” Eichel reiterated in an email. “After consulting with experts in the field, we developed an income-based definition to stay true to the original definition and because the income numbers, available from the Census Bureau, were more reliable than those for home sale prices or rental rates over time.”
Some urban wonks argue that gentrification is too difficult to pin down with any qualitative data. But Pew’s report is far from the first to try to lasso the unwieldy term with an empirical definition.
The Federal Reserve Bank of Philadelphia last year offered up its own analysis of residential mobility in gentrifying neighborhoods, which argued that low-income families might be deterred from moving into gentrifying areas, but there’s little evidence that gentrification displaces existing low-income residents. Critics of this report, which examined residential movement through large-scale consumer credit databases, said it offers a limited perspective on who gentrification effects. (Many low-income residents don’t use credit cards, Lichtash points out.) It is worth noting, however, that the Federal Reserve Report conflicts with Pew’s report in terms of university-spurred gentrification. Whereas tracts near Temple were considered among the “least” gentrified in Pew’s report, the Federal Reserve’s analysis of credit reports found the Temple-area tracts west of Broad Street experienced some moderate gentrification in roughly the same period.
Lichtash was one of the driving forces behind another gentrification study, which was commissioned by the Philadelphia Coalition for Affordable Communities and conducted by Econsult. Between 2000 and 2012, this study found that the African-American population in gentrifying areas of South and West Philadelphia decreased by 29 percent, and by 22 percent in North Philadelphia. But it also measured the rise of cost-burdened households across the city, meaning those that are spending more than 30 percent of their income on housing.
The report also came attached with a policy recommendation for an anti-speculation tax on flipped houses that sell more than once in a two-year period. The proposal has since garnered little support in City Council. But Lichtash says that the PCAC report takes a more nuanced, human approach to gentrification than than the more narrow studies of Pew or the Federal Reserve.
“For us — for those who live, work, and worship in these neighborhoods — we want to address the human cost and the public policy that needs to be developed to address gentrification,” Lichtash said. “The Federal Reserve and Pew doing a study doesn’t care about the human cost, in my mind.”
As noted by several major media outlets after its publication, gentrification is a relatively limited phenomenon in Philadelphia, regardless of which metric is being used. By Pew’s definition, only 15 census tracts experienced an income change radical enough to be gentrified. That’s about 4 percent. Meanwhile, the big takeaway was that 44 percent of the city’s tracts saw income declines.
Despite certain outliers like Temple, Pew’s survey of household income growth did positively identify areas of the city that not only experienced what many agree to be gentrification, but it also identified areas that have experienced rapid disinvestment and wage loss since 2000.
There are plenty of examples that fit a predictable mold. West Philadelphia’s Haddington neighborhood saw a concentrated loss of its household income, in some places as high as 50 percent since 2000. Three of the tracts that experienced the income declines were in and around this section of the city. On the other side of the river, tracts in West Kensington and Strawberry Mansion, neighborhoods with well-known socioeconomic plights, saw some of the largest income losses as well.
And in the same breath, there are pieces of that puzzle that don’t fit any of these narratives. There are tracts in Wynnefield Heights and Oxford Circle that would be considered among the “least gentrifying” in the city, but unlike areas likes Haddington, these sections of the city haven’t been gutted by disinvestment and workforce decline.
In the broader sense, studies of gentrification (and discussions about them) can be illuminating without being conclusive. The “least gentrified” category, according to Pew’s largely income-based definition, leaves several unanswered questions. But by testing different definitions, it’s possible to shed some light on the complex processes at work when neighborhoods change.
WHYY is your source for fact-based, in-depth journalism and information. As a nonprofit organization, we rely on financial support from readers like you. Please give today.


