Mapping affordable housing, crime or development in your Philadelphia neighborhood? Two new tools have you covered.
By Ken Steif
I was recently asked to join my neighborhood Registered Community Organization (RCO) – the Spruce Hill Community Association in West Philly. At my first meeting, a University of Pennsylvania police officer came to talk about local crime. When asked by one of my neighbors about recent crime statistics, the officer had no data on hand.
Later in the meeting, RCO members asked about real estate trends as part of a discussion around a December downzoning overlay bill – a collaboration between the RCO, the Planning Commission and our district City Councilwoman Jannie Blackwell.
Despite the responsibility of RCOs to make zoning recommendations – recommendations that will ultimately impact Philly’s approach to equitable development – I began to worry that many of these decisions were being made without the facts in hand.
These facts are out there, but they are in a form unusable to most. Philadelphia is a national leader in the open data movement, making troves of public city data available for free on OpenDataPhilly. Many datasets from agencies including the police department, the Office of Property Assessments, Licenses & Inspections, Philadelphia Parking Authority, 311 and more are updated at regular intervals, providing the would-be land use planner with a firehose of data that can be integrated across space and time.
But that doesn’t mean its easy for Philadelphians to convert the data into actionable planning intelligence.
My fellow open data enthusiasts in City Hall know this, and with an eye toward getting more people to dip their toe into the ocean of newly available public information about our city, they recently introduced a powerful solution – the Philadelphia Atlas.
The Atlas is an app can retrieve and map open data for (or in proximity to) any address in the city. If you are looking to know the story behind that vacant lot on your block, the Atlas has you covered. But I needed a neighborhood-specific tool that could help me and my RCO evaluate zoning appeals. So, I created a simple report, pulling data from six city agencies into a series of maps and data visualizations that can be adopted and updated in real time by any RCO interested in visualizing data about their community.
If you want to check out a full report, download three example reports I created for RCOs. Keep reading if you want to learn how to create this report for your community.
Concerned Citizens of Point Breeze – download
New Kensington CDC – download
Spruce Hill – download
Some of the analytics from the report are presented below. It is a work in progress and I have no doubt that the metrics provided will leave some planning-related questions unanswered.
Let’s start with crime. The three visualizations below map 30 days of select crimes in the three communities for which I created reports.Spruce Hill is the report on the far left, Point Breeze in the middle and New Kensington to the right.
The data may reveal interesting near-term spikes in crime. For instance, in Spruce Hill, the two green points in the neighborhood’s west side represent two burglaries that happened on the same morning.

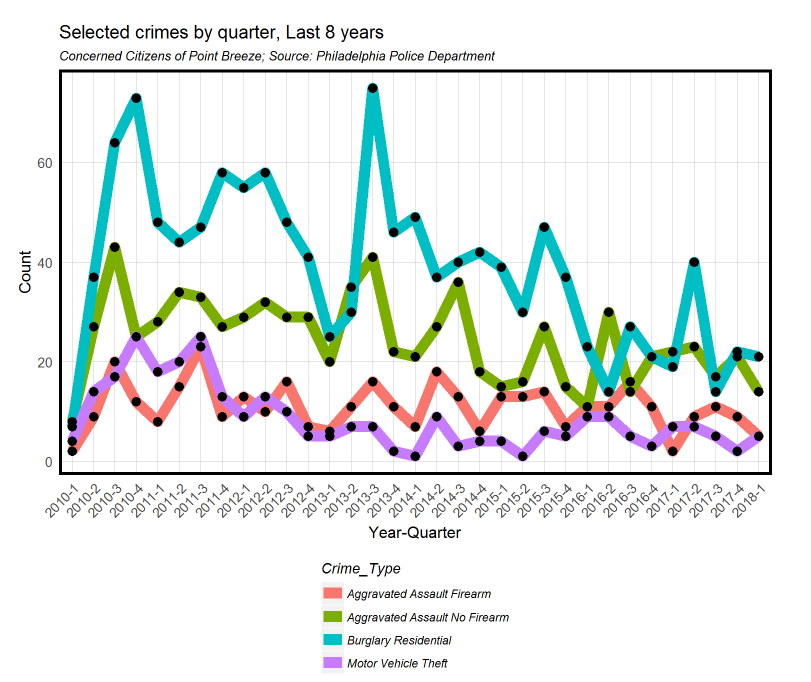
The report also collects historical data going back eight years from the date the report is compiled. According to the crime data plotted in the chart seen below, it appears some crime slowly ticked down in the Point Breeze community over the last eight years.
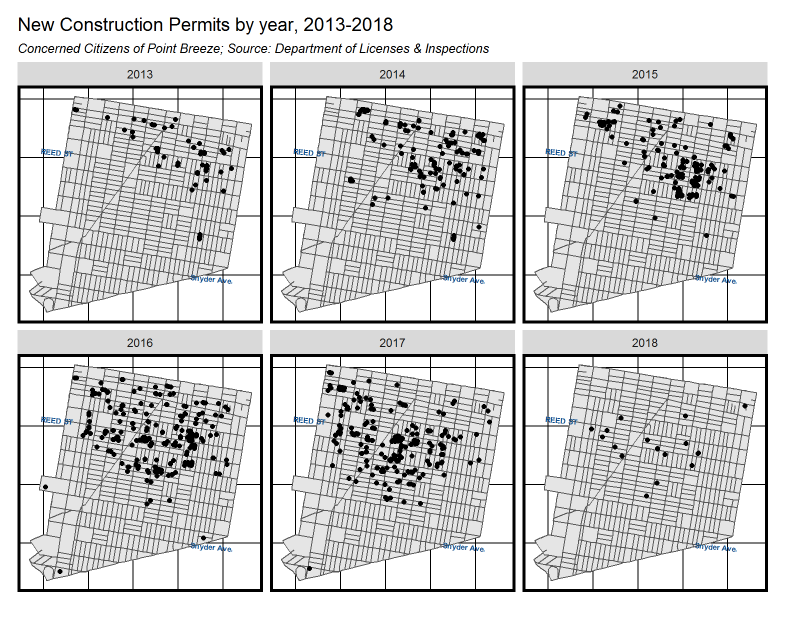
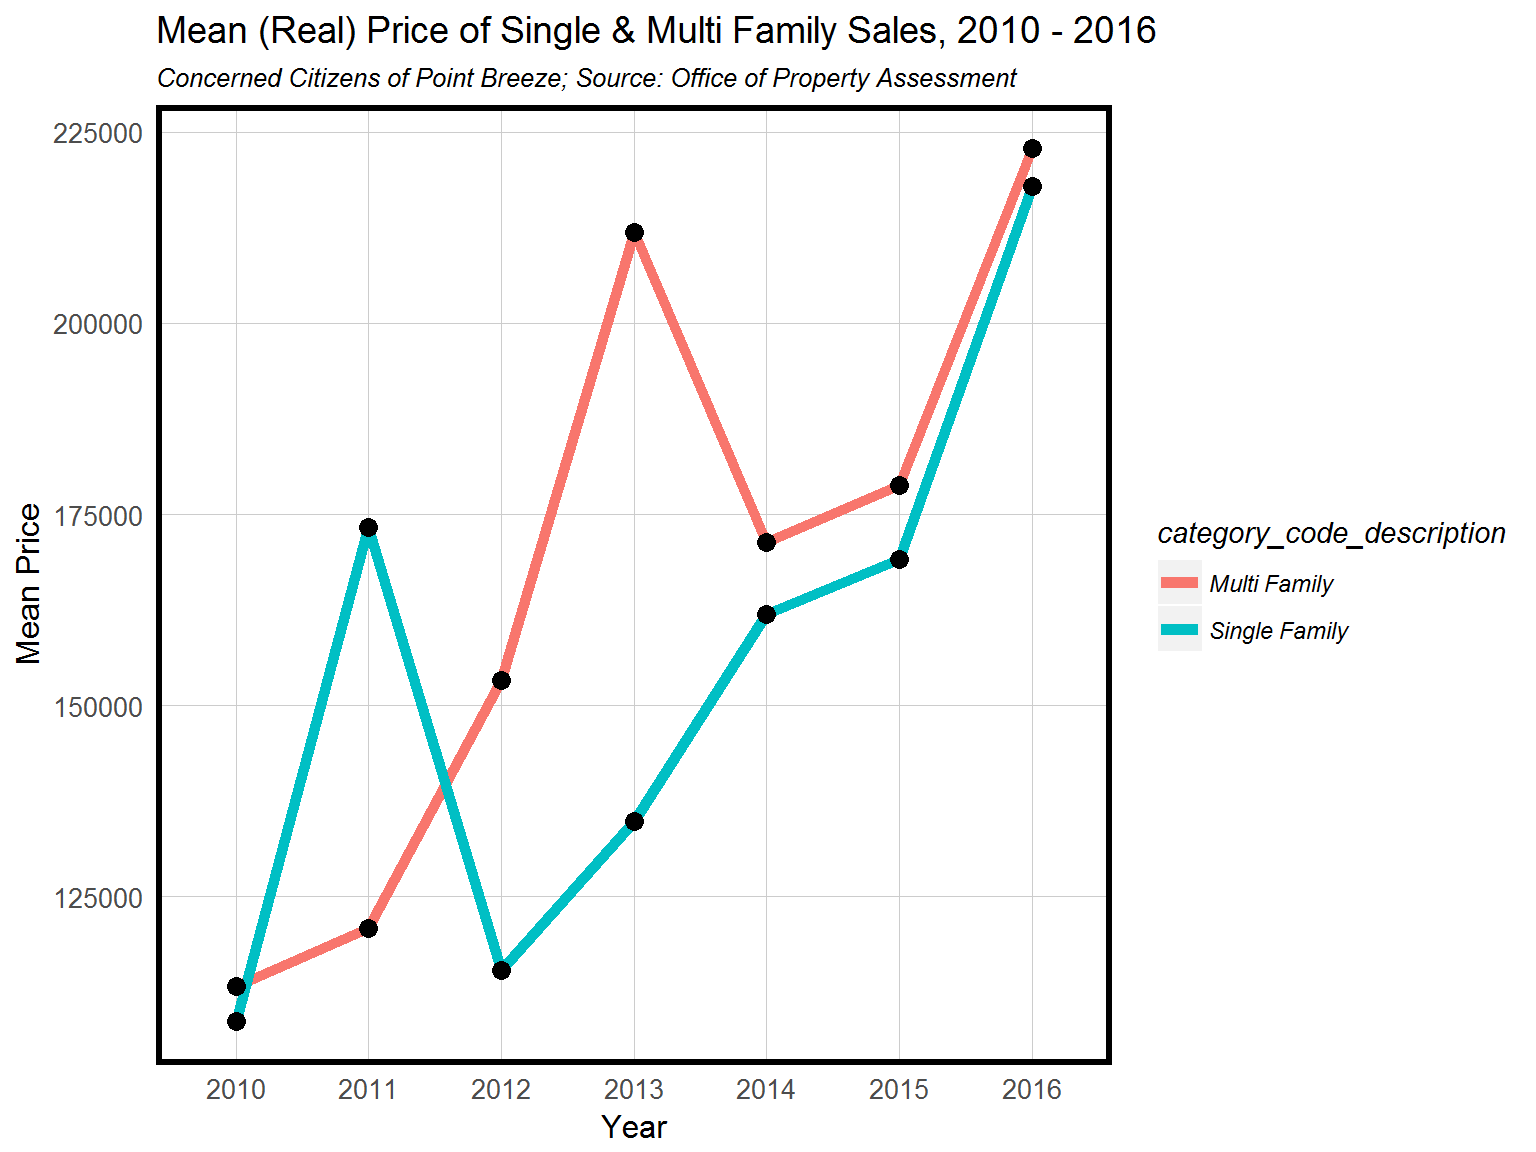
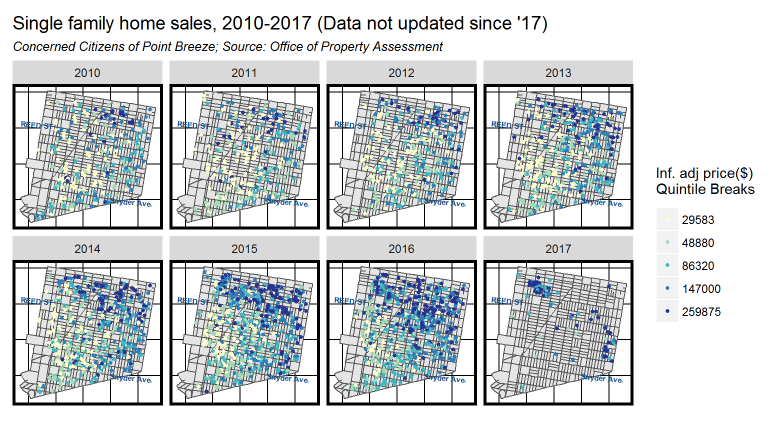
The Point Breeze report contains other fascinating insights about how the neighborhood has changed in recent years. The figure below maps new construction permits over the last five years.
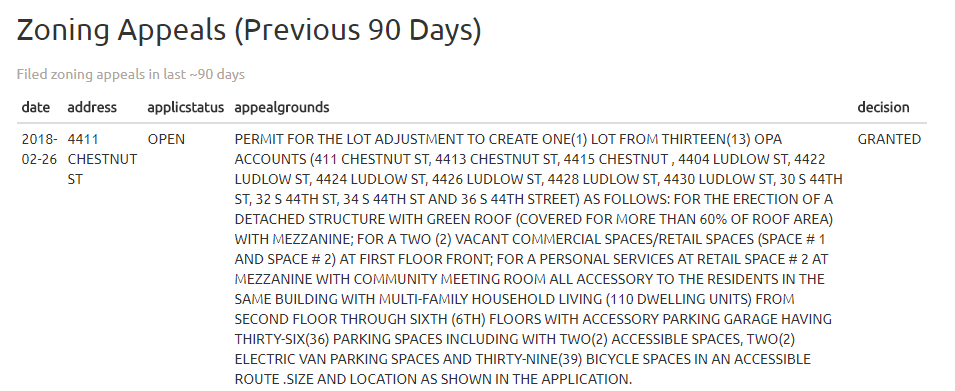
RCOs can also use these data reports to analyze development proposals. In the slide show below, view a recent proposal on 44th street to convert 13 lots into one large lot suitable for a large mixed-use development. Other data sets can reveal more about what’s going on in a neighborhood.
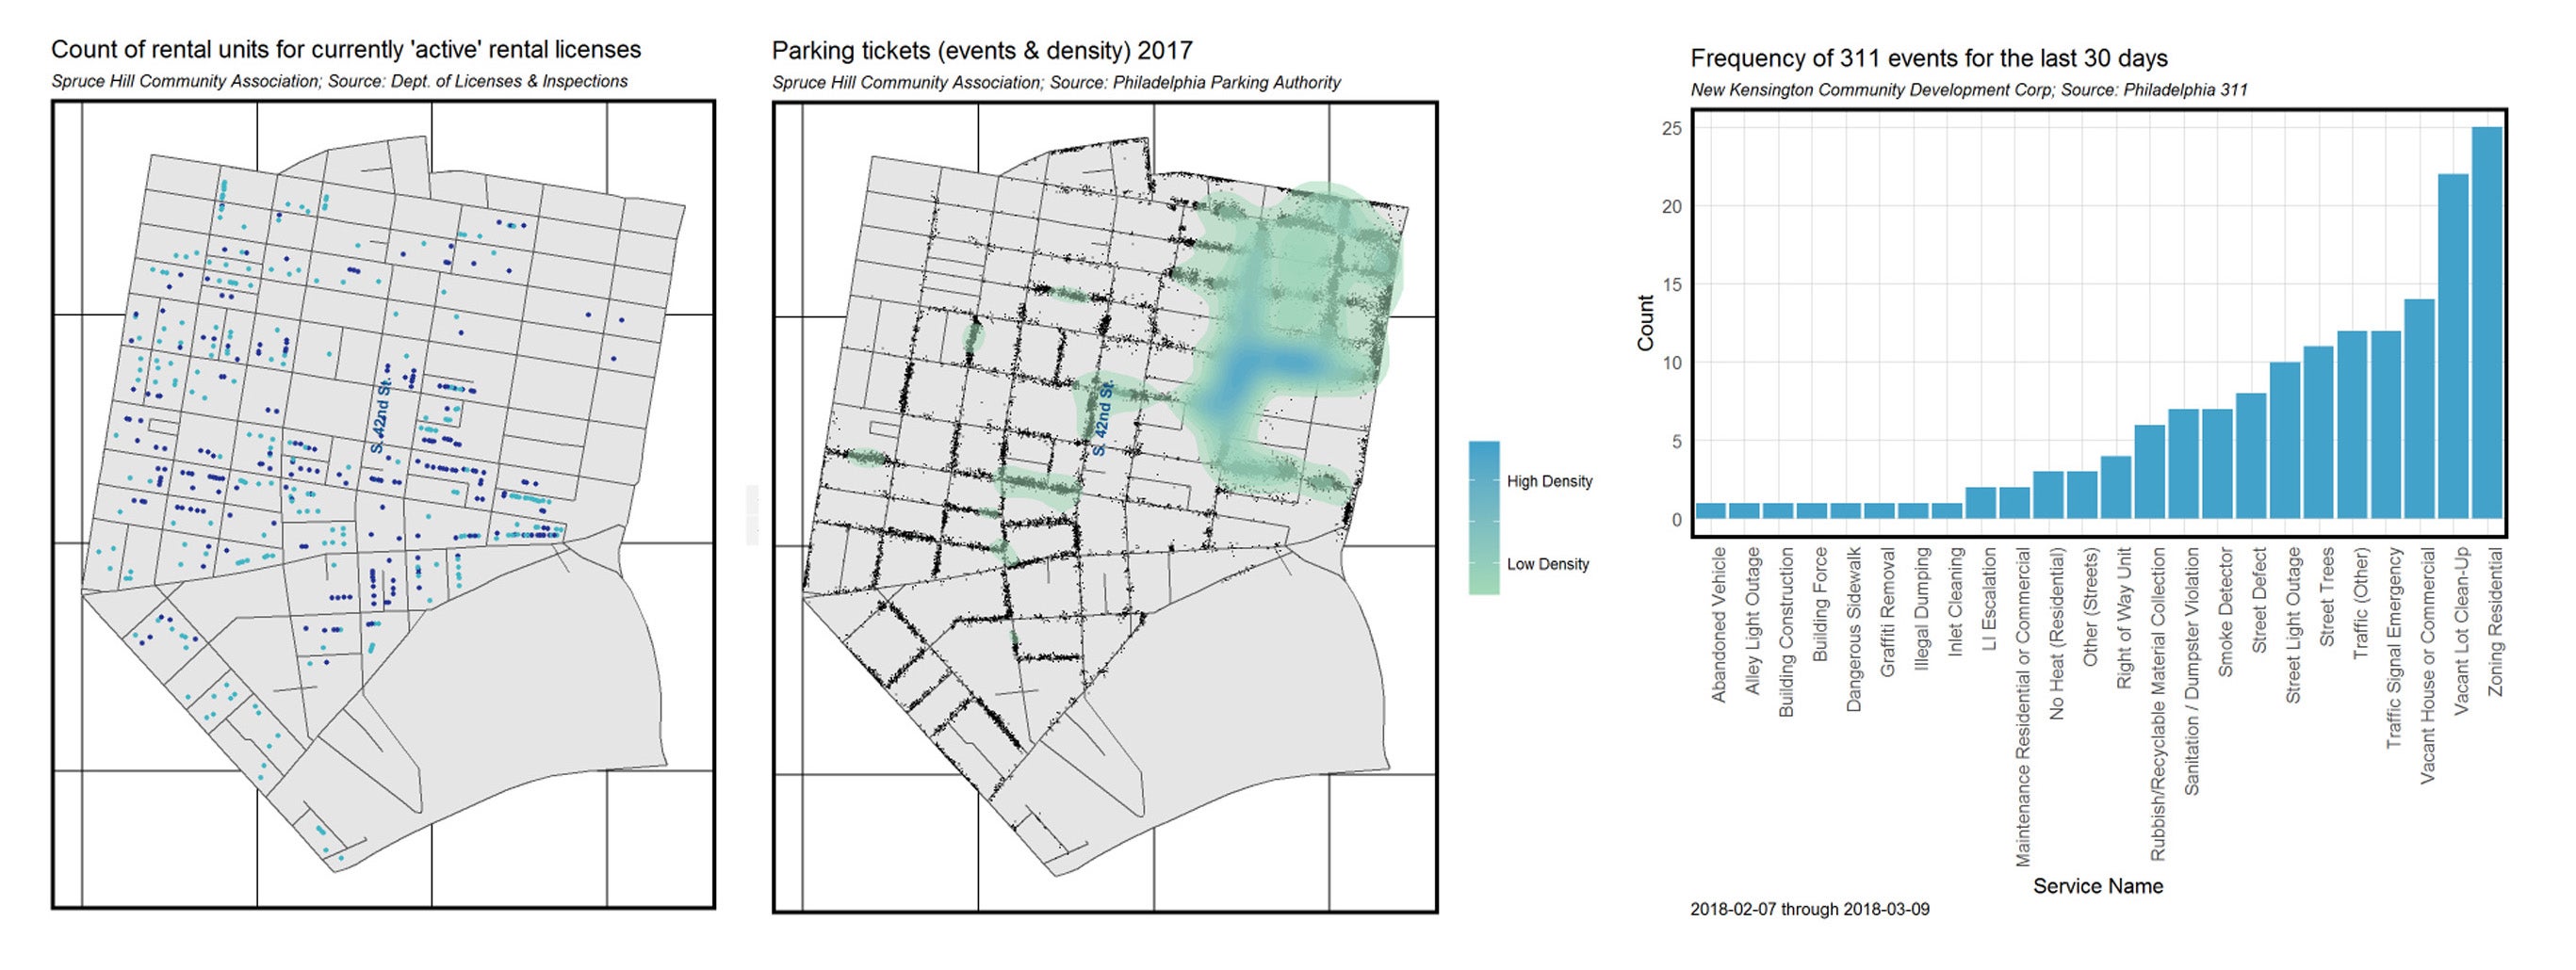
Click on the slide show to see a list of buildings in Point Breeze that L&I has designated as “unsafe” data on active rentals in a neighborhood or parking, an area of perennial interest.
A final example in the slide show comes from 311. Event-specific maps are presented in the report, along with other 311 data. Check out a bar graph of recent 311 event frequencies for a given community.
Of course, the power of this tool lay in its replicability. It is designed to empower residents across the city to play an informed role in shaping the future of their neighborhoods.
Many will immediately be disappointed to learn that you need to have R Studio installed to run the report. (You can download the R Markdown script here).
I have however, provided lots of instructions and comments in the script about the six elements that must be changed to run a custom report. I repeat the same basic approach for each dataset, which I explain here.
A few weeks ago, Councilwoman Quinones-Sanchez published an op-ed in the Inquirer entitled, “Philadelphia Needs a Comprehensive Housing Plan.”
Such a plan would require that all of the aforementioned stakeholders come together to plan for equity in a pro-growth context. If demand for land in Philadelphia continues to grow, data analysis will be essential as policymakers and residents work together to identify areas where density can be increased and those where steps must be taken to limit residential displacement.
I have tried to create a tool that helps RCOs use the data they need to make informed land use decisions. The Philadelphia Atlas is another resource for communities seeking to better understand changes in their communities. Perhaps there are ways these data can be used and presented to help our city reach its equitable development goals.
WHYY is your source for fact-based, in-depth journalism and information. As a nonprofit organization, we rely on financial support from readers like you. Please give today.


