How affordable is housing in Pennsylvania?

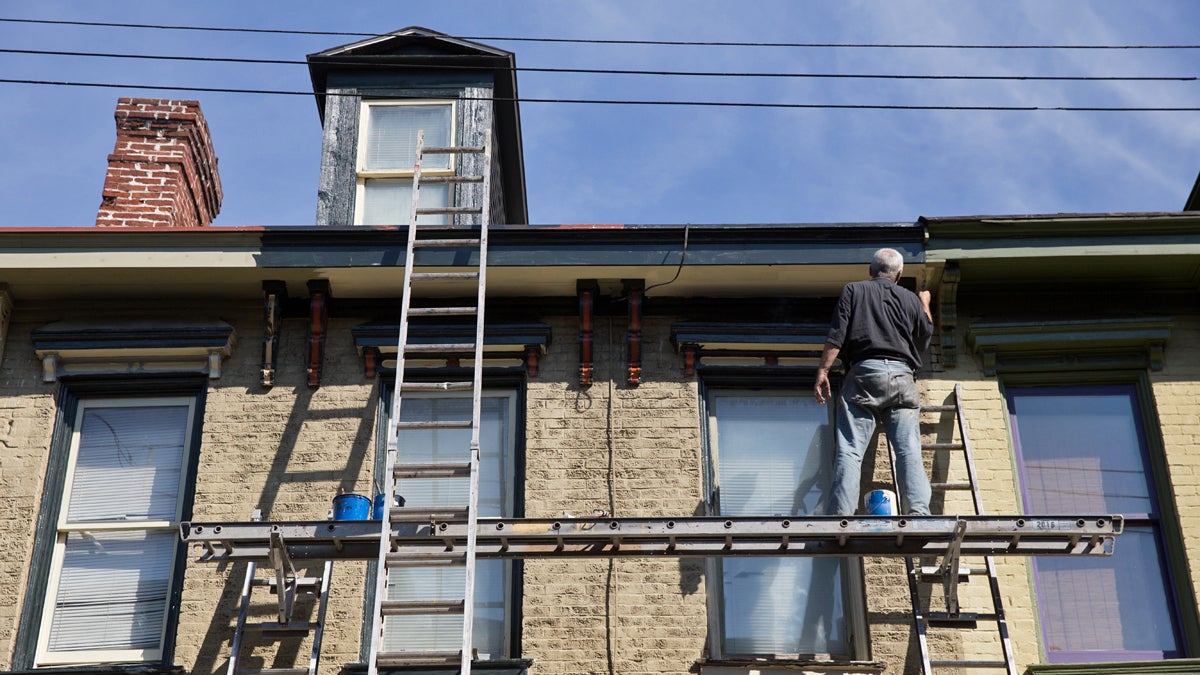
David McCloud restores an aging home in the Mexican War Streets district of Pittsburgh, Pa. New research by the Federal Reserve's Philadelphia office shows a vast majority of lower-income households in Pennsylvania spend more than the conventionally-advised one third of income on housing. (Lindsay Lazarski/WHYY)
Not at all, according to the latest analysis from the Philly Fed.
The vast majority of lower-income households in Pennsylvania, New Jersey and Delaware spend more than the conventionally-advised one third of income on housing.
That’s the primary takeaway form the Federal Reserve’s Philadelphia office housing affordability analysis released Tuesday.
Fed researchers looked at U.S. Census housing cost and availability for low-income, very-low income and extremely low-income renters in 2012 in the Federal Reserve’s Third District and its component states (New Jersey, Delaware, Pennsylvania) and Metropolitan Statistical Areas (Dover, Trenton, Atlantic-City-Hammonton, York-Hanover, Harrisburg-Carlisle, State College, Lebanon, Reading, Allentown-Bethlehem-Easton, Erie, East Stroudsburg, Pittsburgh, Philadelphia-Camden-Wilmington and Lancaster), and the city of Philadelphia.
They consider spending more than 30 percent of income on housing to be a “cost burden”; more than half, a severe cost burden.
Low-income households are defined as having between 51 and 80 percent of the median household income in their region; very low-income, between 31 percent and half; extremely low-income, 30 percent or less.
The other main findings:
1. Pennsylvania’s Metropolitan Statistical Areas ranked worst for all but two potential indicators of an unaffordable rental market. They ranked most favorably for all indicators – but even in these “best case” scenarios, the majority of renters often spent at least a third of their incomes on housing.
The Atlantic City-Hammonton area had the widest gap between actual and affordable monthly rents ($475) for very low-income households facing a cost burden (meaning rent is more than 30 percent of their income) and the highest percentage of cost-burdened low-income renters (66 percent). Both of those numbers likely are up since 2012, as the area’s casino-centric economy continues to degrade.
In Lancaster, 84 percent of very low-income households face cost burdens – the same as with New Jersey’s statewide figure and more than everywhere else.
Pennsylvania had the most distressing statistics in 17 other categories, including:
Median rent for cost-burdened low-income households are $560 more than what would be considered affordable in the Lehigh Valley (the Allentown-Bethlehem-Easton MSA).
More very low-income renters spend more than half their income on housing in Pittsburgh (66 percent) than anywhere else.
Fourteen percent of low-income renters face an extreme cost burden in East Stroudsburg – but that’s the highest rate of all.
2. Rental rates seemed most affordable for cost-burdened renters in the Lebanon region – but not for extremely low-income households.
Actual and affordable monthly rents for cost-burdened households were closer there than any other metropolitan statistical area, states or the Third District as a whole. But at $135 for low-income and $195 for very low-income households, that could be a family’s weekly grocery bill.
The Lebanon area had the lowest percentages of low (2 percent) and very low-income households (20) facing a housing cost burden.
3. The poorest renters fared worst in State College and East Stroudbsurg of all 19 regions examined – and not much better in Pittsburgh, where rates were most affordable.
Sixty-five percent of extremely low-income households paid more than half their incomes to rent in the Pittsburgh area; it was 89 percent in State College
Eighty-one percent paid more than 30 percent of their income to rent in Pittsburgh; it was 95 percent in State College and in East Stroudsburg.
In East Stroudsburg, rents were $704 more than what’s considered affordable (30 percent of income). That was the widest gap. It was narrowest at $380 in Erie, just a bit bigger than Pittsburgh’s $398.
The fewest low-income households faced a cost burden in Pittsburgh: 26 percent.
The full study is available here.
Researchers also compared 2012 data to 2007 numbers, but only in half the geographic areas studied. Based on that, they concluded the shortage of affordable housing worsened during 2007 through 2012.
They also cautioned that they used multi-year data for smaller MSA’s like Lancaster and Lebanon, and single-year numbers for larger ones such as Philadelphia and Pittsburgh.
WHYY is your source for fact-based, in-depth journalism and information. As a nonprofit organization, we rely on financial support from readers like you. Please give today.


