From the Editor: Pedestrians need safer streets. Now!

I think of Zach Woods almost every day.
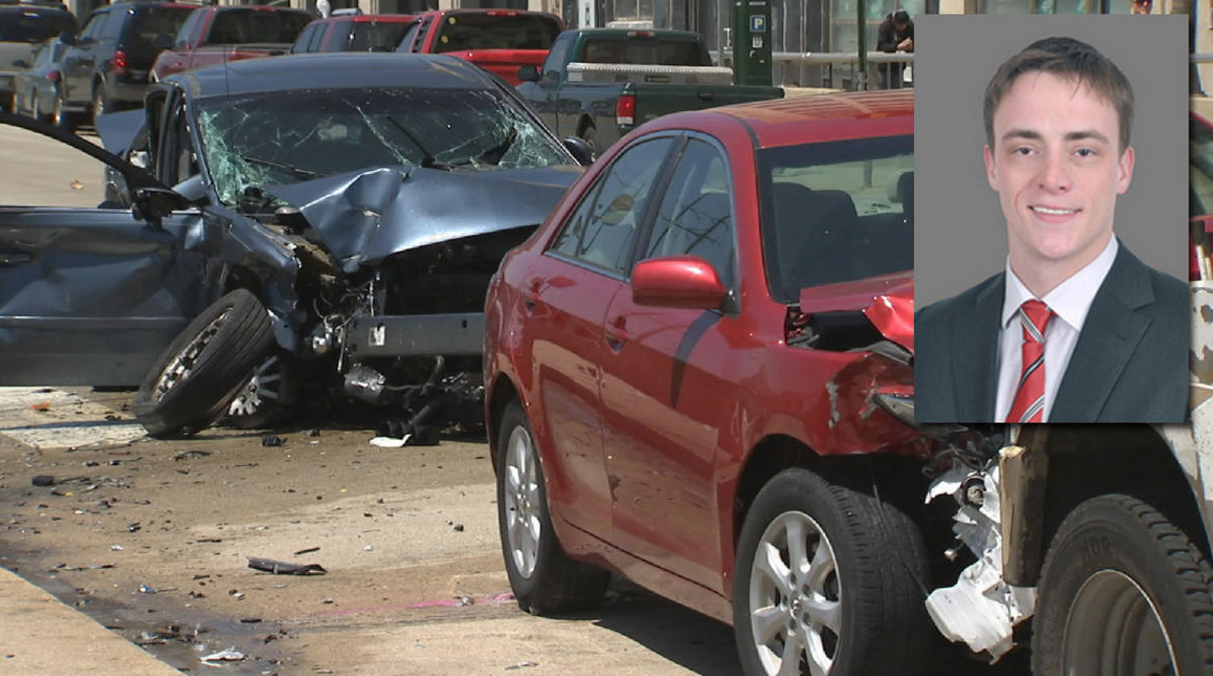
The multiple car crash that took his life happened just seconds before I arrived at the intersection of Walnut Street and 30th Street on a sunny May morning last year.
Woods, a young entrepreneur studying at Wharton, was walking on an elevated section of Walnut toward Center City. A high speed collision pushed a mass of mangled metal towards him. With no time to think he leapt out of the way and onto a traffic light standard. His instincts were perfectly correct, but the force of the cars pushed the signal pole and Zach over the guardrail and onto the pavement below. He died later that day.
Zach Woods’ untimely and unnecessary death underscores a wicked problem Philadelphians deal with every day.
When you walk along certain streets in this most walkable city, and a ton of people get around this city by legging it, you take you life in your hands.
Don’t believe it? Well just read the data and map heavy piece PlanPhilly’s Jon Geeting and Azavea’s Daniel McGlone produced this week. For regular walkers like me it makes all the anecdotal, scary near misses starkly real.
Since 2008, the number of Philadelphia pedestrians hit by cars has held steady at over 1,700 per year. The exact number has jumped around a bit from year to year, but what’s important to know is that the numbers aren’t falling. The toll actually increased in 2013 (the most recent year we have data for) to 1,773, up from 1,751 in 2012. There were 37 pedestrian deaths in 2013, and 195 total since 2008.
Here is the interactive map plotting each pedestrian-car collision within city limits between 2008-2013. But Geeting and McGlone aren’t done with you yet.
“The street safety issue is something we both care about, and we felt that having the political conversation about this up at the 30,000 foot level wasn’t moving the needle,” Geeting said Sunday. “Now that there’s a more fine-grained look at where the problem areas are, neighborhood groups will have some powerful, actionable information to take to their district City Council members when asking for safety improvements.”
Today, PlanPhilly and Azavea show you the most dangerous intersections in each of the 10 City Council districts, along with some tables on the 10 most dangerous intersections within each District.
The Azavea/PlanPhilly work corroborates a 2014 Slate analysis meant to determine which U.S. City has the worst drivers. That study relied on four indicators in order to rate vehicle operators: years between traffic accidents; automotive fatalities; alcohol-related driving deaths; and pedestrian strikes. They ranked the cities in each category and then combined those into a single ranking. Here’s the spreadsheet containing the data they used.
Miami was overwhelmingly the worst city. But we were second, thanks to second-places finishes in collisions and pedestrian strikes.
WHYY is your source for fact-based, in-depth journalism and information. As a nonprofit organization, we rely on financial support from readers like you. Please give today.


