

Delaware Smarter Balanced: new scores send mixed signals


Governor Jack Markell presents the state's test scores at a briefing. (Avi Wolfman-Arent, NewsWorks/WHYY)
The much-anticipated results from Delaware’s new, tougher state test are in, and, well, they’re mixed.
As expected, the number of students deemed proficient on the first ever Smarter Balanced assessment was significantly lower than the number deemed proficient on its predecessor, known as DCAS.
Delaware students, did, however, outperform projections based on a 2014 field test of Smarter Balanced. Compared to students in other states who took the same Smarter Balanced test, Delaware youngsters finished middle of the pack.
Taken all together, the data sends a mixed message on student performance.
“The main thing is we’re being honest,” said Governor Jack Markell of the new test. “I mean because the alternative is to not do this and not share information. And a dose of honesty is very much in order here.”
For the past year, state and district leaders have warned that scores would plummet on the new test because it is aligned with the tougher Common Core State Standards and because it measures more complex thinking skills. Those warnings proved largely accurate.
| % Proficient — 2014 | % Proficient — 2015 | Percentage Point Change | |
| Grade 3 — English | 70.3 | 54.2 | -16.1 |
| Grade 3 — Math | 71.9 | 53.1 | -18.8 |
| Grade 4 — English | 73.1 | 53.6 | -19.5 |
| Grade 4 — Math | 74.5 | 46.6 | -27.9 |
| Grade 5 — English | 76.4 | 55.5 | -20.9 |
| Grade 5 — Math | 70.6 | 38.0 | -32.6 |
| Grade 6 — English | 73.1 | 48.5 | -24.6 |
| Grade 6 — Math | 65.5 | 34.1 | -31.4 |
| Grade 7 — English | 71.1 | 50.3 | -20.8 |
| Grade 7 — Math | 65.5 | 36.7 | -28.8 |
| Grade 8 — English | 71.3 | 49 | -22.3 |
| Grade 8 — Math | 68.5 | 35.1 | -33.4 |
| HS — English* | 75.1 | 51.9 | -23.2 |
| HS — Math* | 68.5 | 23.3 | -45.2 |
The drop-offs were most severe in the higher grades, particularly for math. Less than a quarter of the state’s 11th-graders demonstrated proficiency in math, down from nearly 70 percent the year prior. Students performed far better in the lower grades. Just over half of Delaware third-graders reached proficiency on the math assessment.
That trend is consistent with early results from other Smarter Balanced states–the test was administered in 17 other states–and state officials say it reflects the shift to new standards. Younger students, they point out, have been learning Common Core math since they entered school. Older students had to switch mid-stream, when Delaware adopted the standards five years ago.
The new math standards are widely considered to be a significant departure from past math standards, while the new English standards more closely resemble older benchmarks.
“It’s an entirely different way of thinking,” Markell said of the new standards. “Particularly for the older kids, they’ve never really had that before.”
The Governor reitirated, however, his position that Delaware needs to raise standards so that students graduating from its schools can compete in an increasingly globalized economy against the best and brightest from abroad.
“Higher standards are not meaningful unless we’re able to measure if our students are meeting them,” Markell added.
Delaware students did out-perform projections based on a field test taken last year by 4 million students. Those field tests were used to establish scoring scales and set baseline expectations for how students would perform when the test went live.
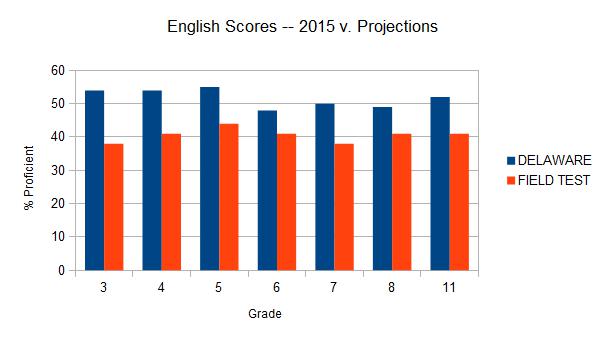
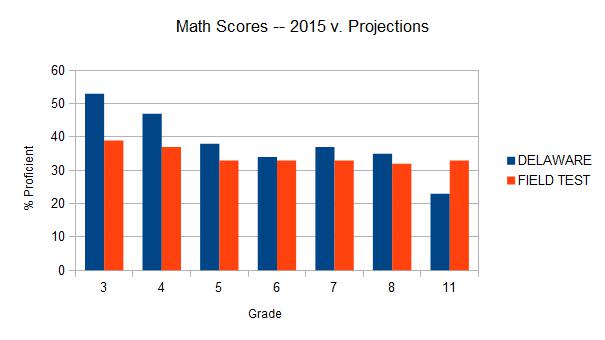
Delaware students bested the projections in every grade and subject area except one, 11th-grade math.
“Although we raised the bar considerably, our students performed better than anticipated,” Markell said.
Delaware, however, was far from the only state to out-perform expectations. In fact, of the seven other Smarter Balanced states to report scores so far, all except one, West Virgina, consistently out-performed field-test projections. There are still 10 other Smarter Balanced states that have yet to report scores.
Compared to the states that have already published final or preliminary results, Delaware’s scores were about average. In math, for instance, third-graders from the First State did better than students in every state except one. Delaware eleventh-graders, however, fared worse in math than students from every state except West Virginia.
For a more complete analysis of how Delaware stacked up against other Smarter Balanced states, check out our other coverage.
Delaware’s results are only preliminary at this point, although officials don’t expect them to change much. The state released test scores to each district and school last week so that local officials could double-check figures. The final numbers will be released at a state board meeting later this month. At that point, Delaware will also publish more granular test data that shows, among other things, how different demographic subgroups performed on Smarter Balanced.
The state will also send individual student score reports to parents next week by mail.
There’s been considerable chatter–some might say consternation–about the lag between when students took the test this spring and when the results were published. Under the old test, scores were available almost immediately after the testing period, which allowed schools and parents to get an early read on how students were doing before the next school year began.
The Smarter Balanced exam, state officials say, takes longer to score because it tests more difficult concepts and often grades students on how they arrived at an answer–not simply if they answered it correctly.
The Delaware Department of Education says results came out particularly late this year because the test was new. Officials believe scores could be released up to a month earlier in 2016.
The percent of students who participated in the state’s new standardized test also dipped modestly compared to last year, evidence that some parents did opt their children out of Smarter Balanced.
| Paricipation Rate — 2014 | Participation Rate — 2015 | Percentage Point Change | |
| Grade 3 — English | 99.1 | 98 | -1.1 |
| Grade 3 — Math | 99.5 | 97.2 | -2.3 |
| Grade 4 — English | 99.2 | 97.5 | -1.7 |
| Grade 4– Math | 99.5 | 96.9 | -2.6 |
| Grade 5 — English | 99.2 | 97.2 | -2 |
| Grade 5– Math | 99.5 | 97 | -2.5 |
| Grade 6 — English | 98.8 | 97.9 | -0.9 |
| Grade 6 — Math | 99.1 | 97 | -2.1 |
| Grade 7 — English | 98.8 | 97.4 | -1.4 |
| Grade 7 — Math | 99 | 96.5 | -2.5 |
| Grade 8 — English | 99 | 97.2 | -1.8 |
| Grade 8 — Math | 99.1 | 95.6 | -3.5 |
| HS — English* | 95.1 | 90.5 | -4.6 |
| HS — Math* | 95.5 | 89.3 | -6.2 |
The state doesn’t yet know what proportion of the drop off is due to parent opt-out or other forms of principled objections to the test, and what proportion may be due to other causes such as truancy.
Delaware’s overall test participation rates did , however, remain above the federally mandated 95 percent threshold.
State officials stressed that this year’s results should be viewed as a sort of staistical reset given that Smarter Balanced is significantly different and more difficult than its predecessor. In coming years, officials will be able to use 2015 data as a measuring stick for future progress.
“This year’s test established a new baseline,” said Secretary of Education Mark Murphy. “It’s a new baseline to measure progress from this point forward.”
* Delaware tested 11th-graders in 2015, but not in 2014. The “HS” participation rates and test scores refer to 10th-graders who took the test in 2014 and 11th-graders who took the test in 2015.
WHYY is your source for fact-based, in-depth journalism and information. As a nonprofit organization, we rely on financial support from readers like you. Please give today.

Delaware earns national recognition for arts vibrancy, reflecting a decade of public investment
A national report highlights how sustained public investment and community support have strengthened Delaware's cultural landscape.
24 hours ago

July 9 - July 12: K.C. and the Sunshine Band in Delaware, Blobfest in the Philly burbs and Dave Matthews Band in South Jersey are among weekend event highlights.
4 days ago
Listen 5:39
Wilmington took down the bronze memorial to the long-revered signer of the Declaration of Independence during racial unrest in 2020.
4 days ago
Listen 2:11