As Philly’s violent crime drops, mapping the neighborhoods where it doesn’t
Listen-
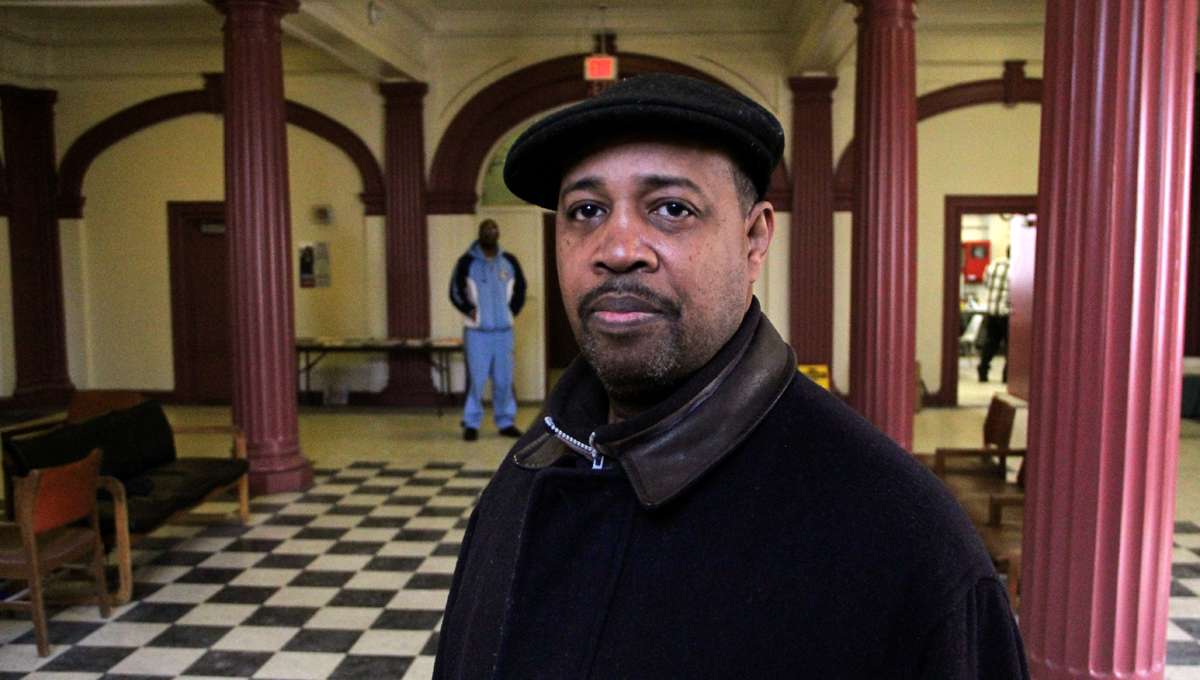
Every Tuesday, Kevin Horne and other like-minded men from Southwest Philadelphia meet at Kingsessing Rec Center. Their goal is to reduce crime and improve their neighborhood. (Emma Lee/for NewsWorks)
-
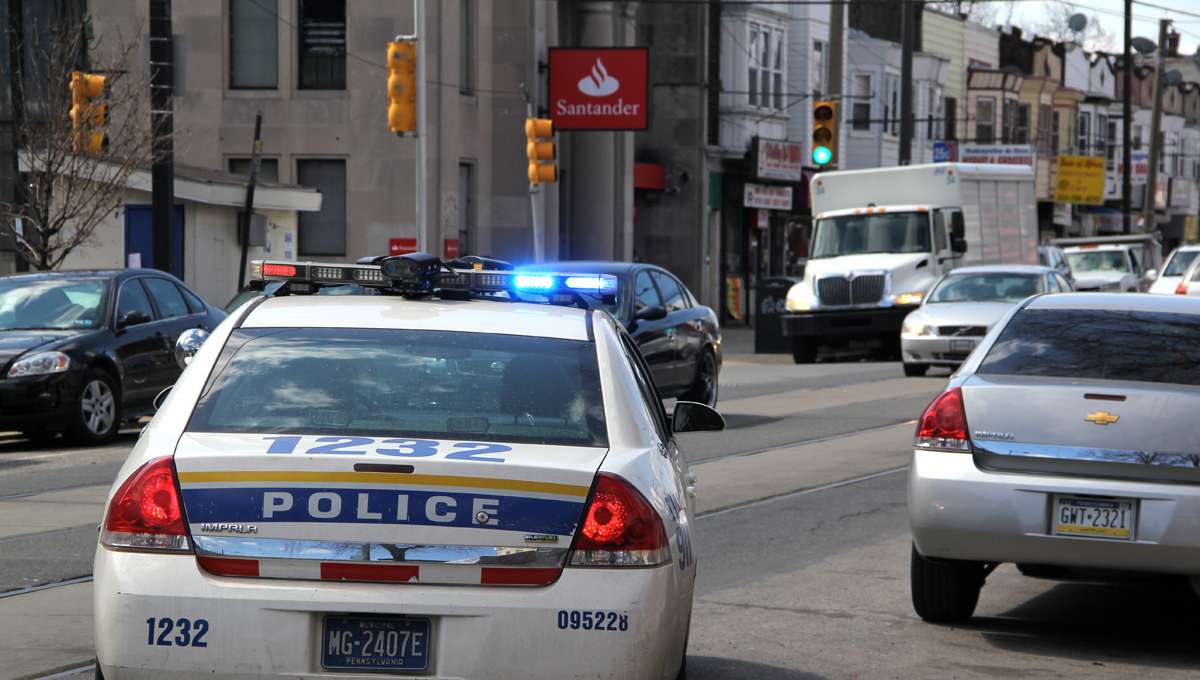
A police cruiser pulls onto Woodland Avenue in Southwest Philadelphia. (Emma Lee/for NewsWorks)
-

Philadelphia police data experts Kevin Thomas (left) and Anthony D'Abruzzo review data at the Crime Analysis Lab at police headquarters. (Emma Lee/for NewsWorks)
-
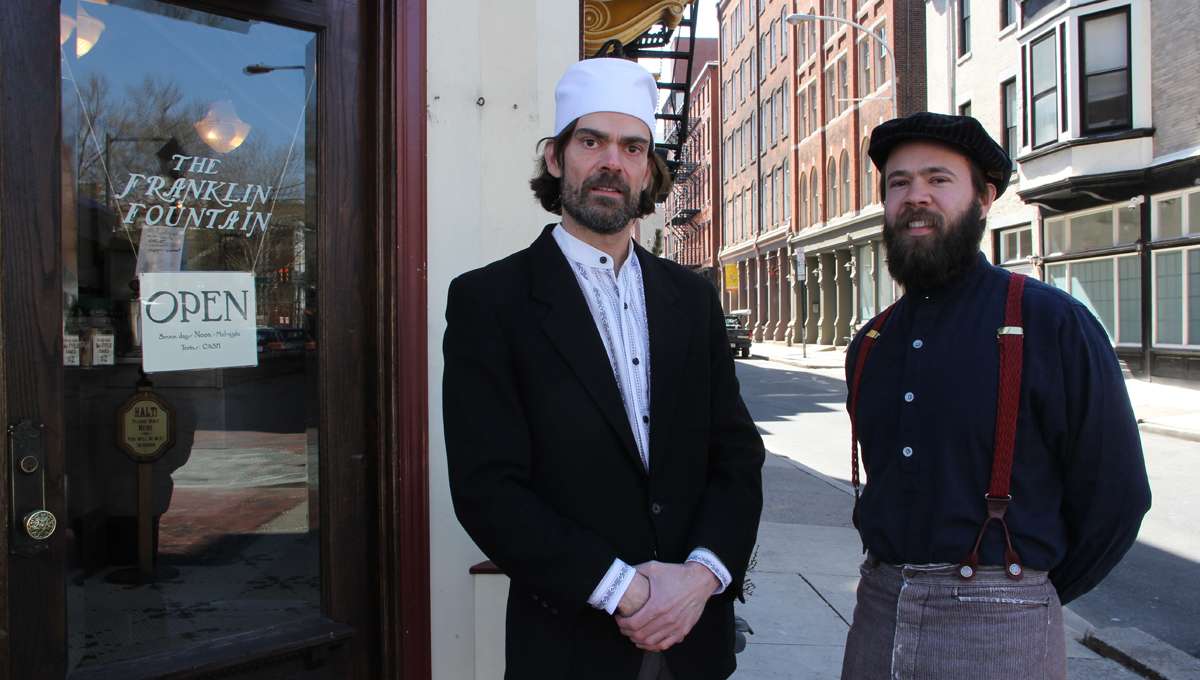
Ryan Berley (left), with his brother Eric, owns the Franklin Fountain in Old City, where crime is down. (Emma Lee/for NewsWorks)
For a long time, the Philadelphia Police Department rarely had good news to share.
That’s changed.
From 2012 to 2013, the number of homicides in the city dropped by 25 percent, and violent crime also fell across the board.
In the first three months this year, the positive trend mostly continued. While the number of homicides increased compared with the same period in 2013, from 55 to 62 slayings, violent crime as a whole plummeted 11 percent.
Upon closer inspection, though, the story is more nuanced than the one that has been told at news conferences.
Some city neighborhoods have seen crime fall dramatically, while others have actually seen it go up.
Old City’s ‘secret’ weapon
In Philadelphia’s Old City neighborhood, there is a retro ice cream parlor called The Franklin Fountain, where men in bow ties and women in 1900-era outfits serve you sundaes with names like “The Stock Market Crunch.”
It’s hard to believe that a few years ago, the shop’s co-owner Eric Berley was nearly assaulted in this placid environment, according to his brother and business partner, Ryan.
“A fellow came into the building, entered through the private entrance,” said Ryan. “He grabbed a kitchen knife in the cellar of the shop and was wielding it and trying to get into my brother’s apartment.”
No one was hurt, but Ryan blames the frightening incident on a larger trend that swept through the area starting in the mid-2000s. Ryan, who was president of the Old City Civic Association until it disbanded last year, says the neighborhood became the place to drink on the weekends, and a few bars in particular attracted trouble.
Residents say that has changed recently, though.
NewsWorks analyzed crime across the city by “census tracts” — small geographic areas that each have a few thousand residents. In census tract 1, which encompasses most of Old City, the violent crime rate fell by 40 percent from 2012 to 2013. Last year, there were 6.6 violent crimes per every 1,000 residents, compared to 10.9 the year prior.
Ryan credits closing some nuisance bars and an improving neighborhood economy.
“There’s really been a boom in tech companies,” he said. “Old City, for a long time I think, was a nighttime destination only, but I think that trend is changing.”
Graham Copeland, executive director of the Old City District, says it also helped that his organization hired private security guards to monitor bars on weekends. Old City District is one of Philadelphia’s 14 special services districts, in which business or property owners pay a fee for improvements in the area.
“They’re checking in with the front door guys at each of these establishments, and they have radio communications,” said Copeland, “so if ever there were a problem, there is a quick response coordinated.”
A different story
Old City is not unusual. In most parts of Philadelphia, or 233 of the city’s 384 census tracts, the violent crime rate dropped from 2012 to 2013.
But in almost one-third of the city’s census tracts (126), the crime rate went up. (The rate stayed the same in 16 census tracts, and nine census tracts were not included in our analysis because they have a low population.)
Take census tract 64 in the Paschall area of Southwest Philly. In 2012, there were 10.3 violent crimes per 1,000 residents, roughly the same crime rate as in Old City. But in 2013, the violent crime rate shot up by about 30 percent.
Deputy City Commissioner Tracey Gordon, a longtime block captain in Paschall, has noticed an uptick in crime. Her neighbor’s house was broken into last year, she says. A home-invasion robbery also happened a block away in December, according to police.
Gordon says the area would be better off if it had a special services district, like Old City. But it’s not that easy. Typically, it is up to private businesses to decide whether to develop such a district.
“The gentrified areas, they’re organizing and they have enough money to have … additional service districts,” said Gordon. “But in our working-class neighborhood, we only have to rely on the police district, and that’s not enough.”
Kevin Horne, a member of the community group Southwest Philadelphia District Services, blames the crime on too few employment opportunities.
Many moons ago, he was in a Southwest Philly gang. He’s now a married suburban dad who volunteers in the neighborhood, trying to create more jobs. He is currently working to establish an area where vendors can regularly open for business.
“If there’s somebody out there robbing somebody, I don’t think they just robbing them to get kicks out of it,” he said. “They robbing people because they hungry.”
Are security officers the answer?
So what’s the lesson here? Does every neighborhood simply need a private security force, or more police if it can’t afford one?
Kevin Bethel, a deputy commissioner in the Philadelphia Police Department, says in an ideal world, sure, the city would have more cops.
“Would I like to have a workforce of 20,000 officers?” he asked. “There’s no doubt about that. But I don’t have that, so we try to use the men and women that we have to be more strategic.”
However, he’s not as quick as residents to say why crime is up or down in a particular neighborhood. He cautions it can be misleading to look at only a couple years of crime statistics.
Asked why crime is dropping in the city overall, Bethel says it is largely due to the police department’s data-driven crime-fighting strategy that focuses on Philly’s most violent areas.
He does point out, though, that police foot patrols were used in Old City in 2013, whereas Southwest Philly’s 12th police district did not have foot beats then. That could be a factor in the crime trends, he says. (Foot patrols returned to the 12th district this year.)
When shown a map developed by NewsWorks of neighborhood crime trends, Bethel also noted that violent crime increased in many of the city’s low-income areas from 2012 to 2013.
But there are plenty of exceptions to that. Several parts of North Philly, which struggle with high levels of poverty, saw crime drop in that time period.
Kevin Thomas, a department crime analyst, says it can be difficult to pinpoint an explanation for neighborhood crime trends because of the nature of law enforcement. He says police simultaneously try several different tactics to reduce crime, and that makes it tough to prove what, exactly, did the trick.
“These are real problems and these are real shootings. These are real neighborhoods that are getting impacted, so what typically happens is we sort of throw the kitchen sink out there,” he said. “So it’s very difficult to break apart what programs are really having an effect and what are not.”
That doesn’t mean officers aren’t trying. The police department recently graduated its first class of data scientists, who are trained to measure crime-fighting strategies.
Plus, Deputy Commissioner Bethel says he is examining the NewsWorks map to see if he can learn anything from it.
—
Casey Thomas contributed reporting to this story.
CLARIFICATION: The interactive map above has been adjusted to reflect updated numbers from the Philadelphia Police Department. [April 14, 2014]
WHYY is your source for fact-based, in-depth journalism and information. As a nonprofit organization, we rely on financial support from readers like you. Please give today.

