

A website about the U.S. electricity grid offers a mesmerizing way to pass the time productively
While millions of Americans hunker down, work from home, and try to stay busy and entertained amid a pandemic, much of our infrastructure hums along as normal, unseen and unap

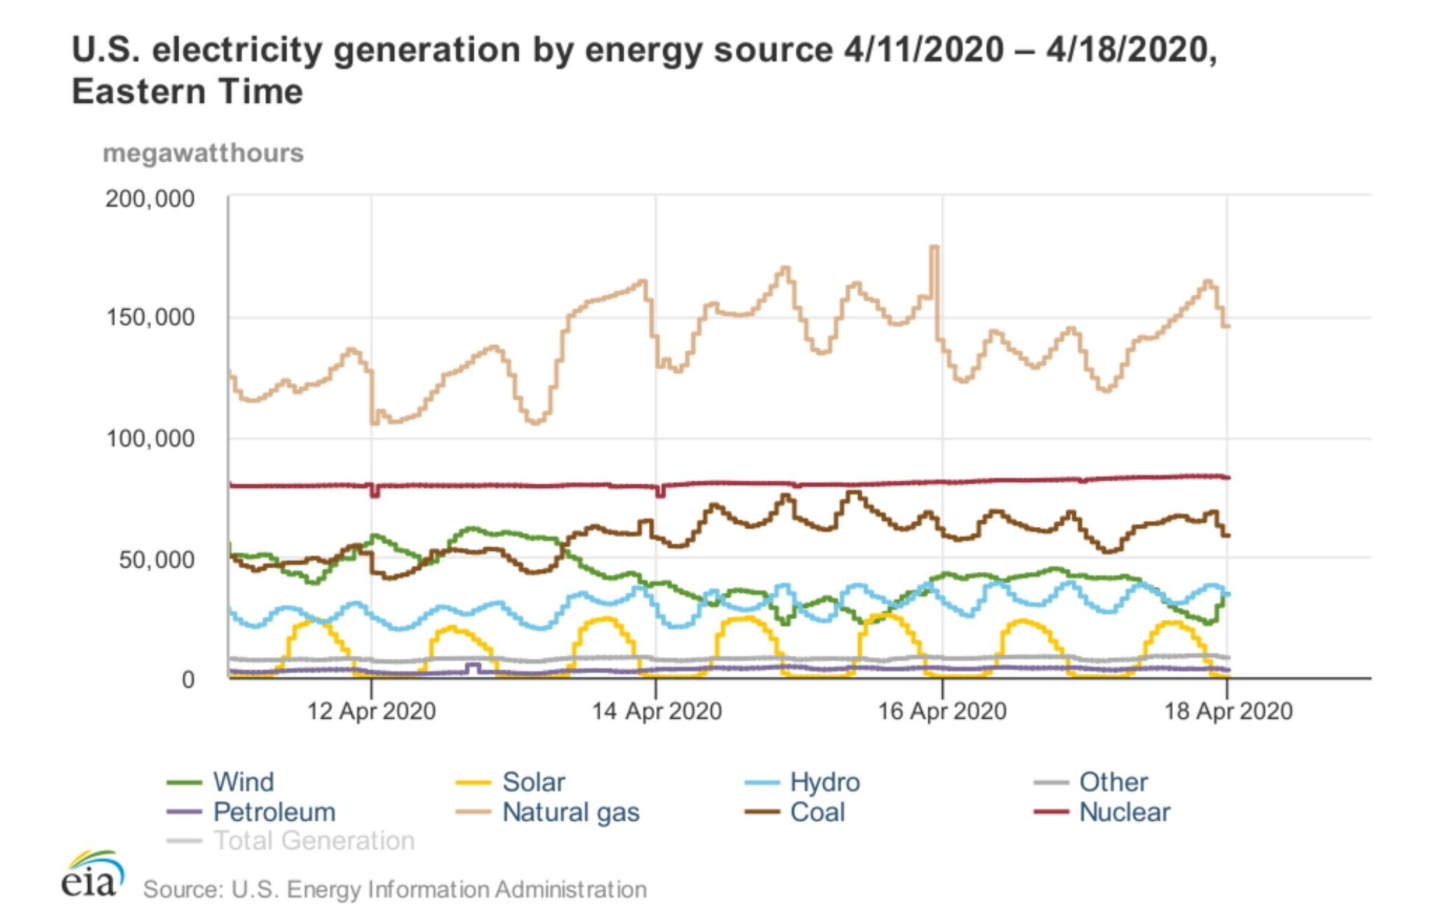
(Source: U.S. Energy Information Administration)
This article originally appeared on StateImpact Pennsylvania.
–
While millions of Americans hunker down, work from home, and try to stay busy and entertained amid a pandemic, much of our infrastructure hums along as normal, unseen and unappreciated. The electric grid is one such behemoth, supplying a steady stream of electrons, on demand for every need and whim, all day and all night.
It’s hard to wrap one’s head around something as large and complex as a nationwide energy supply, but a tool from the Energy Information Administration makes it both possible and downright fascinating.
The dryly named Hourly Electric Grid Monitor is a looking glass onto the nation’s electricity network in real time. Poking through the dashboard-like display is mesmerizing, prompting deep exploration – an ideal thing to do when one’s time and curiosity may both be running a surplus.
Under Montana’s statewide stay-at-home orders, I spent a slightly voyeuristic afternoon examining how each region of the U.S. is balancing its electricity needs. There are encouraging examples where renewable energy is deeply offsetting fossil fuels, and the EIA grid monitor makes it clear where more progress is needed. But the most delightful finding was the way energy use visibly sags on weekends and the realization that the grid is simply an expression of our cumulative behaviors.
Related Content

Pennsylvania raises alarms on transfer of radioactive Three Mile Island reactor
DEP asks the Nuclear Regulatory Commission to slow down the review of a license transfer due to the coronavirus emergency.
6 years ago
Listen 1:56Here are 10 snapshots from around the grid. Each one sheds light on the ways we use energy around the country, throughout the day, and across the seasons.
Electricity demand peaks twice each day
The alarm clock sounds. Coffee brews while cell phones and laptops chirp to life. Lights are switched on; and then the weather and morning news. The day sets into motion. As the familiar ritual is repeated by millions of people, a distinct wave ripples across the electricity grid. The morning peak in energy demand has arrived.
From about mid-fall through late spring, the daily appetite for electricity peaks twice each day. The dinner-time hours spur a second surge in energy use, and then the demand for energy drifts down to a night-time lull.
This pattern can be seen in all but the southernmost parts of the country right now. In warm weather, peak electrical demand occurs during mid-afternoon heat.
We use less electricity on weekends
On a Saturday morning, electricity use rises gradually, just as people do. Weekend patterns of electricity use are spread out over a flatter, smaller peak, and energy demand is muted because offices are closed and manufacturing ramps down.
The contrasting shapes of the curves on a Saturday morning and a Monday morning reflect the collective actions – or inactions – of millions of people.
Related Content

EPA rolls back air regulations for waste coal plants in western Pa., W.Va.
Mercury rule exemption applies to three plants in Pennsylvania, one in West Virginia
6 years ago
Coronavirus restrictions are becoming visible in electricity use patterns
A reasonable hypothesis is that closures of schools and workplaces would cause electricity consumption to look more like weekend patterns. So far, that does not appear to be the case. As of March 27, the typical contrast between weekends and weekdays persists, even in the regions like California and New York where people’s activities are most restricted. The example below, from Seattle, shows weekend demand remains smaller.
However, a detailed look at time-of-day electricity use by the Energy Information Administration shows lower overall demand and more gradual rise in morning energy consumption; and New York is reporting a 6% to 9% reduction in electricity usage as of late March. So, the effects of virus restrictions are starting to appear but are hard to pick up without close scrutiny.*
Texas shows the interplay of wind and natural gas
The EIA grid monitor shows the sources of electricity operating at any given time, revealing the intricate dance between renewables and fossil fuels. In Texas, for example, wind and natural gas provide most of the electricity, and the relationship between those two resources is intriguing. On days when the wind is strong, Texas’s 28 gigawatts of wind generating capacity can harness the resource, and the use of natural gas is correspondingly low. On March 7-8, for example, wind supplied the vast majority of electricity in Texas.
When the wind subsides, natural gas fills in the gap, as seen on March 10. On March 11 and 12, the outputs of wind and natural gas are perfectly out of phase, with gas scaling up and down to complement wind. All told, wind supplies 17.6% of electricity use in Texas, and the state is the nation’s leader in wind energy generation.
California leads the way with solar
California has installed 27 gigawatts of capacity of utility-scale solar energy. That generates most of Golden State’s electricity from 7:00 AM to 8:00 PM this time of year. As with Texas, the downtime of renewable energy is filled in by natural gas.
In July, the solar energy peak is longer and more powerful than it is in March, and natural gas fires up briefly to get Californians through the evening peak in energy use.
But in the winter, solar energy generates fewer watt-hours and lasts only for eight hours. Solar generation puts a dent into the daily energy supply, but the overall portfolio is sustained by natural gas.
California generates 20% of its electricity from solar, and it’s the country’s leading generator of solar energy.
These detailed views of Texas and California illustrate why improving storage of renewable energy is essential if we are to keep reducing fossil fuel use.
The northwestern region uses its rivers
An abundance of hydroelectricity is evident in the northwestern region’s grid. The twice-daily spikes in demand are matched by outflow from dams, while coal, gas, and wind serve as supplements. At peak generation, 15% to 30% of electricity generated in this region is exported to California.
Nuclear power operates at a steady pace
In contrast to the peaks and valleys of other types of generation, nuclear energy is a flat line on the graphs. Nuclear power plants can’t change output quickly, so they chug along at a steady equilibrium, leaving it up to other types of energy to respond to fluctuations in demand.
Energy flows into and out of regions to maintain balance on the grid
‘Interchange’ shows electricity moving among different utilities and regions. In this snapshot, the Midwest region is exporting electricity to Tennessee, while importing electricity from Canada and three other regions. The ability to import and export electricity is a key part of the renewable energy puzzle, as energy can be distributed to help match production in one area with demand in another.
Use the Grid Monitor to explore energy around the U.S.
The tool can be used to look at the whole country, various regions, or specific utilities (called ‘balancing authorities’ on the tool). Data is available in real time or for any time in the recent past, and specific dates can be queried. To view graphs similar to the ones in this article, click on a region and then scroll down through the various displays. Most of the displays can be customized, allowing you to investigate all sorts of energy questions.
In this time of personal and national introspection, it seems somehow fitting to use a small part of your daily electricity supply to examine the inner workings of the nation’s infrastructure. It can help the public and policymakers appreciate the pulses of current that power our lives and maybe even come up with some suggestions for improving the flow.
*Editor’s note: This paragraph was added to the original post on April 7 when EIA publicly provided additional information about this site.
![]() This story originally appeared in Yale Climate Connections and is republished here as part of Covering Climate Now, a global journalism collaboration committed to strengthening coverage of the climate story.
This story originally appeared in Yale Climate Connections and is republished here as part of Covering Climate Now, a global journalism collaboration committed to strengthening coverage of the climate story.
WHYY is your source for fact-based, in-depth journalism and information. As a nonprofit organization, we rely on financial support from readers like you. Please give today.
Part of the series


Climate change may increase risk of new infectious diseases
Researchers found that cross-species virus spread will happen thousands of times among mammals if the world warms by 2 degrees Celsius.
4 years ago

What happens to the coronavirus when it gets warmer?
It’s a difficult question, but no matter what the answer is, the pandemic is not going to stop anytime soon.
6 years ago
Listen 1:36
How the coronavirus pandemic has disrupted field research
Lack of data gathering could have a major impact on ecological studies and the young scientists who do them.
6 years ago
Listen 10:57