

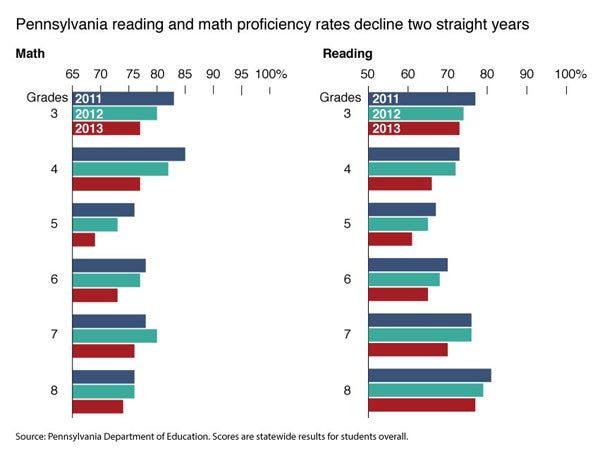
With election near, still no Pa. test results; 2013 scores showed a downward trend

(Emma Lee/WHYY)
Have standardized test scores declined for a third year in a row in Pennsylvania?
We’re not likely to find out before the gubernatorial election next week.
This year, the Pennsylvania Department of Education has waited longer than usual to publicly release any data on test scores or school performance.
State officials say they are still checking for errors and don’t have a release date. And they say also that PDE is now focused on its new school rating system, the School Performance Profile (SPP) and is de-emphasizing comparisons of standalone test scores. The SPP includes multiple measures of achievement including attendance and student progress.
The state says it is being especially careful.
“The reason why there is an extra effort this year to make sure that the scores are accurate is because the 2013-14 school performance profile is the first year that impacts teacher evaluations,” said PDE spokesman Tim Eller.
One high-ranking Senate Democrat says that is hogwash, and that the scores are being delayed for political reasons – because they will hurt Gov. Corbett’s re-election chances.
The fact that scores went down two years in a row, in 2013 as well as in 2012, has scarcely been reported in the press.
Statewide data for 2013 is not prominent on the PDE website, but shown on a separate site containing data required for federal reporting purposes and linked to the new performance profiles.
When the Notebook and NewsWorks examined the data on that site this week and looked closely at the results, they showed that statewide proficiency rates on the PSSA exam dropped for every grade level (grades 3-8) in reading and math, by an average of 3 to 4 percentage points, between 2012 and 2013.
The scores also dropped for almost all subgroups of students – most dramatically for at-risk populations, including economically disadvantaged students and African Americans.
Eller claimed not to know if scores went down statewide between 2012 and 2013, saying, “I have not specifically looked at that. I’m focused on SPP only now.”
However, he said, the tests were adapted to more rigorous standards starting in the 2012-13 school year, which could account for any decline.
Putting the 2013 statewide test results on a website that was never publicized is one of several moves by the state that, deliberately or not, served to obscure the statewide trend of declining PSSA scores in an election year when schools are at the top of the political agenda.
For instance, PDE never announced publicly the 2013 statewide results nor pointed out that this was the second consecutive year that scores went down. It changed the format of its required state report format for 2013 so that year-to-year score comparisons that used to be presented are no longer available. And it never posted the 2013 PSSA results on its webpage that links to historical data for each year’s state assessment going back to 1995.
Last fall, even though the state released PSSA test results for every school in the commonwealth, officials did not provide any accompanying statewide PSSA data – in an abrupt departure from past practice.
Over the past year, the extent of the statewide decline in 2013 PSSA scores appears never to have been reported in the media.
This year, as of late October, PDE has sent only preliminary test score information to school districts, but has released no data at all to the public.
In past years, preliminary district-by-district results were made available as early as June, and detailed statewide reports have generally been out by the end of September.
The exception was last year, when Secretary of Education Carolyn Dumaresq unveiled the new School Performance Profiles on Oct. 4, saying that PDE was overhauling the way it evaluates schools and giving each of them a score based on multiple performance measures.
At the time, Dumaresq said the state would no longer highlight year-to-year comparisons of proficiency rates for schools, districts, and the state as a whole.
For nearly a decade before that, state officials had played up those comparisons –annually trumpeting statewide PSSA improvements when they released test score data. The release of data in 2012 broke that streak, when then-Secretary of Education Ronald Tomalis said that scores had declined by 1-2 points due to new anti-cheating test security measures.
Requests for results rebuffed
State Sen. Andrew Dinniman, D-Chester, the minority chair of the Senate Education Committee, has been petitioning the Department of Education for statewide test results for months. He says he’s been denied.
He dismisses PDE’s rationale for delaying the release, calling the delay “unconscionable.” He described it as a ploy to deflect negative publicity away from Gov. Tom Corbett’s reelection campaign.
“The department can use whatever excuses it wants,” he said in a telephone interview. “It’s clear to me that the administration is purposely not releasing these scores because they fear a discussion that will focus on negative impacts of the Corbett budget cuts and of his education policy.”
“In my view, they’re not going to release this until after the election, and they’ve been playing games,” he said. “All the school districts are waiting. Everyone’s waiting.”
Told of Dinniman’s charges, Eller laughed and disputed them.
“This has nothing to do with an election,” he said, reiterating that the state is focused on making accurate data that will have an impact on teachers’ evaluations. Dinniman is the one playing politics, he said, calling the Senator’s remarks “unfortunate” but not surprising.
Many school districts were asked to comment for this story. Most did not return calls for comment. The Philadelphia School District declined.
Jack Silva, the assistant superintendent of the Bethlehem Area School District, said the delay in releasing the scores has affected the district’s ability “to complete our evaluation of employees that require the scores.”
Silva said Bethlehem’s preliminary look at their 2014 scores showed small declines in most tested grades and subjects, a fact he said couldn’t be divorced from “years of budget cuts and not replacing staff – and reduced supports for kids.”
Dinniman believes the scores will show a continued downward trend that he says comes as a direct result of districts having less support for classroom spending under Corbett’s watch.
“When you cut money from places like Philadelphia and Reading and York, you’re going to see the results in test scores,” he said.
“The larger story is that, the Corbett educational policies, they don’t want to show the results of them in terms of the tests.”
Eller’s view is different. The amount of money is not the issue, he said. “It’s how that money is used.”
Delay criticized
The release of state test score data this late goes against federal best practices. The U.S. Department of Education’s guidance to states urges release “before the school year begins or as early in the school year as possible.” This is better for parents and educators, the guidance says. Officially, though, the data isn’t due until January.
The delay in releasing state data raised questions for some testing experts, including Andy Porter of the University of Pennsylvania.
“This all sounds very strange to me, that you wouldn’t report state results in a timely fashion because you think they aren’t accurate,” said Porter, dean of Penn’s Graduate School of Education. “Why aren’t they accurate?”
Porter said that publicizing statewide results is important, especially if a state institutes new policies, as Pennsylvania has done. He said it’s especially important given that now there is a major shift in how teachers are evaluated.
“The state is initiating new teacher evaluations. Don’t we want to track if student achievement gets better after major policy changes?”
PDE’s Eller countered that nothing is being obscured. “It’s completely transparent.” He acknowledged, though, that the statewide scores “could be more prominent on the department’s website.” He also said that the 2013 scores should be the “new baseline” rather than looking at earlier years.
Concerned about downward trend
Others are concerned about what the 2011-2013 test scores show, saying that the consistent, downward trends make it all the more important to see the 2014 scores.
“It is increasingly urgent for PDE to release the 2014 PSSA test results,” said Kate Shaw, executive director of Research for Action and a former state deputy education secretary.
“Between 2011 and 2013, scores have dropped in every subject, in every grade, and among every group of students. Drops are particularly steep among students most at-risk— Black, Latino, English language learners, and the economically disadvantaged. In some instances, we see double-digit decreases for these groups.”
She added, “This is not surprising given what’s happening in Pennsylvania. We are moving towards higher academic standards during a time when state funding for our public schools has plummeted.”
Shaw said that the consistency of the downward trends makes them more worrisome. “I don’t think you can dismiss that,” she said. “It’s pretty notable.”
She and other researchers suggested that these scores be compared with the results of the National Assessment of Educational Progress, or NAEP, which are given every other year to a sampling of 4th and 8th graders and are considered the “gold standard” of testing. In most states, including Pennsylvania, proficiency rates on the state test far exceed proficiency rates on the NAEP.
Although the overall scores are lower, the NAEP trends between 2011 and 2013 in Pennsylvania look better than the PSSA trends. Eighth grade scores on the NAEP were up in reading and math while fourth grade results were flat.
Eller says that it is premature to draw conclusions about any patterns or trends in PSSA scores.
“There have been a lot of changes in the standards over the last several years,” he said. “Now we’re at a point where the standards [and exams] have been stabilized…I think you’re going to start seeing the exam results starting to improve because now everything is on level ground.”
Silva, of Bethlehem, isn’t so sure that will happen unless districts become able to restore some of the programs and personnel they have lost.
“You can’t deny that access to resources – afterschool programming, reading specialists, family and mental health supports, all those other things that removed obstacles to help students learn – when those services aren’t there, the obstacles to learning stay put.”
This story is the product of a reporting partnership between Philadelphia Public School Notebook and WHYY/NewsWorks.
WHYY is your source for fact-based, in-depth journalism and information. As a nonprofit organization, we rely on financial support from readers like you. Please give today.

Jacqueline S. Mattis, dean of the School of Arts and Sciences, made more than $100,000 for hosting writing retreats, some of which took place in Jamaica.
22 hours ago

Centennial School District launches summer lunch bus
Bensalem Township School District’s summer lunch program inspired Centennial’s initiative.
6 days ago

A combination of promotion and recruitment strategies has kept the international student population at universities stable.
1 week ago
Listen 1:04