Philadelphia’s new contingent of community schools, by the numbers
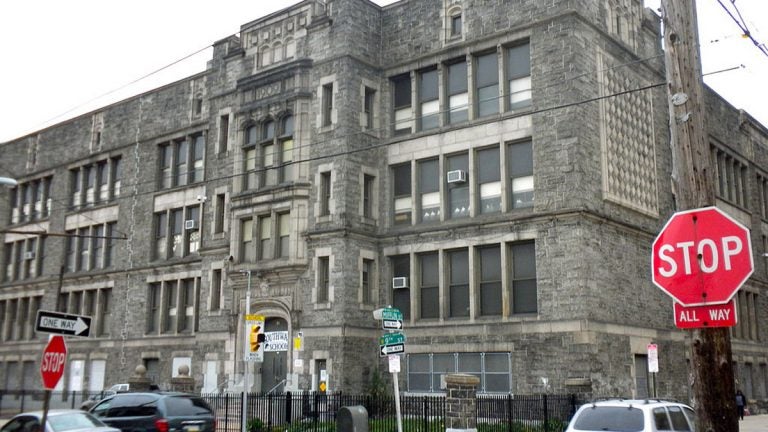
Southwark School
There is no such thing as a typical community school.
Different versions of that sentiment have been repeated ad infinitum by members of Philadelphia Mayor Jim Kenney’s administration as they’ve readied the public for the new community schools initiative. Now that the city has officially named its first nine community schools, those careful disclaimers have been borne out.
The group of schools named Monday represent a wide range of student subgroups, academic track records, and neighborhoods. No two schools better represent that range than Edward Gideon north of Brewerytown and Southwark near East Passyunk Avenue.
Gideon sits in a census tract where more than half of the residents live below the federal poverty line, where the median family income is just a hair over $12,000 a year, and where two-thirds of residents over 16 are either not in the labor force or unemployed.
When principal Shauneille Taylor talks about the challenges facing her students, she’s thinking about the basic necessities. Taylor keeps a cupboard full of emergency granola bars, dispensing them to students she can tell haven’t eaten.
“At times, that’s the only meal that they’re receiving,” she said.
The neighborhood surrounding Southwark is a different world.
Located three-and-a-half blocks east of a booming commercial corridor, Southwark is in the crosshairs of gentrification. Median home values in the surrounding neighborhood are $75,000 above the city average, and rose nearly $20,000 between 2010 and 2014.
Still, Southwark’s students face enormous challenges, in part because the school population doesn’t yet reflect the changes in the surrounding neighborhood. Almost half of Southwark students are English language learners, and many have fled violence and poverty in their home countries, said Beth Dougherty, chair of the East Passyunk Crossing Civic Association’s Education Committee.
“When kids hear a thunderclap or hear a police siren, they dive under the desk because these are kids from refugee camps,” said Dougherty.
Southwark will likely focus more on uplifting the school community itself and less on the community surrounding the school, she said. Leaders also want to make sure they aren’t using the community schools initiative to improve Southwark in a way that accelerates gentrification.
“We’re really aware of this, and we are struggling ourselves to figure out how to keep the neighborhoods from basically kicking kids and families out,” said Dougherty. “You make a school great, and then the families can’t afford to live there. How do you stop that from happening?”
All of which is to say, each community school will be confronting a distinct set of problems.
Snapshots
Below we’ve compiled some basic data on each school for a sense of the variety represented in this first cohort of nine schools — both in terms of the schools themselves and the neighborhoods where they reside. We also highlighted the number in red if the data point was the lowest in a given category or indicated the greatest need. We used green to highlight the opposite.
William T. Tilden Middle School
Grades: 5-8
Council District: 2
Enrollment: 470
English Language Learners: 12.8 percent
Special Education: 17.9 percent
Average Daily Attendance: 83 percent
Rank on School District Progress Report: 36th out of 36 middle schools
School Performance Profile Academic Score: 32.6
NEIGHBORHOOD
Adults reporting poor or faith health: 35.2 percent
Adults forgoing health care due to cost: 11.8 percent
Poverty Rate (census tract): 28.5 percent
Median Home Value (census tract): $79,500
2014 Shooting Victims (police district): 85
Murell Dobbins CTE High School
Grades: 9-12
Council District: 5
Enrollment: 599
English Language Learners: 2 percent
Special Education: 15.5 percent
Average Daily Attendance: 92.3 percent
Rank on School District Progress Report: 60th out of 82 high schools
School Performance Profile Academic Score: 44.6
NEIGHBORHOOD
Adults reporting poor or fair health: 37 percent
Adults forgoing health care due to cost: 19.4 percent
Poverty Rate (census tract): 33.6 percent
Median Home Value (census tract): $53,400
2014 Shooting Victims (police district): 117
Kensington Health Sciences Academy
Grades: 9-12
Council District: 1
Enrollment: 442
English Language Learners: 18.3 percent
Special Education: 28.1 percent
Average Daily Attendance: 83.9 percent
Rank on School District Progress Report: 65th out of 82 high schools
School Performance Profile Academic Score: 38.9
NEIGHBORHOOD
Adults reporting poor or fair health: 24.8 percent
Adults forgoing health care due to cost: 30 percent
Povery rate (census tract): 17.1 percent
Media home value (census tract): $111,100
2014 Shooting Victims (police district): 42
South Philadelphia High School
Grades: 9-12
Coucil District: 2
Enrollment: 710
English Language Learners: 22.8 percent
Special Education: 30.8 percent
Average Daily Attendance: 83.3 percent
Rank on School District Progress Report: 81st out of 82 high schools
School Performance Profile Academic Score: 43.6
NEIGHBORHOOD
Adults reporting poor or fair health: 21.9 percent
Adults forgoing health care to cost: 14.7 percent
Poverty Rate (census tract): 16.2 percent
Median Home Value (census tract): $179,300
2014 Shooting Victims (police district): 20
Edward Gideon Elementary/Middle School
Grades: K-8
Council District: 5
Enrollment: 328
English Language Learners: 0
Special Education: 14.6 percent
Average Daily Attendance: 94.8 percent
Rank on School District Progress Report: 109th out of 140 K-8 Schools
School Performance Profile Academic Score: 48.3
NEIGHBORHOOD
Adults reporting poor or fair health: 37 percent
Adults forgoing health care due to cost: 19.4 percent
Poverty Rate (census tract): 53.9 percent
Median Home Value (census tract): $41,400
2014 Shooting Victims (police district): 117
Southwark Elementary/Middle School
Grades: K-8
Council District: 1
Enrollment: 660
English Language Learners: 49.8 percent
Special Education: 9.5 percent
Average Daily Attendance: 96.1 percent
Rank on School District Progress Report: 55th out of 140 K-8 Schools
School Performance Profile Academic Score: 57
NEIGHBORHOOD
Adults reporting poor or fair health: 21.9 percent
Adults forgoing health care due to cost: 14.7 percent
Poverty Rate (census tract): 12.6 percent
Median Home Value (census tract): $218,000
2014 Shooting Victims (police district): 20
F.S. Edmonds Elementary School
Grades: K-5
Council District: 9
Enrollment: 486
English Language Learners: 0.6 percent
Special Education: 18.5 percent
Average Daily Attendance: 96.3 percent
Rank on School District Progress Report: 32nd out of 59 elementary schools
School Performance Profile Academic Score: 62
NEIGHBORHOOD
Adults reporting poor or fair health: 25 percent
Adults forgoing health care due to cost: 14.3 percent
Poverty Rate (census tract): 13 percent
Median Home Value (census tract): $157,300
2014 Shooting Victims (police district): 62
James Logan Elementary School
Grades: K-5
Council District: 8
Enrollment: 264
English Language Learners: 0.8 percent
Special Education: 16.7 percent
Average Daily Attendance: 94.5 percent
Rank on School District Progress Report: 21st out of 59 elementary schools
School Performance Profile Academic Score: 56.8
NEIGHBORHOOD
Adults reporting poor or fair health: 25 percent
Adults forgoing health care due to cost: 14.3 percent
Poverty Rate (census tract): 22.4 percent
Median Home Value (census tract): $83,000
2014 Shooting Victims (police district): 98
William Cramp Elementary School
Grades: K-5
Council District: 1
Enrollment: 538
English Language Learners: 23 percent
Special Education: 13.4 percent
Average Daily Attendance: 94.5 percent
Rank on School District Progress Report: 36th out of 59 elementary schools
School Performance Profile Academic Score: 50.5
NEIGHBORHOOD
Adults reporting poor or fair health: 30 percent
Adults forgoing health care due to cost: 25.4 percent
Poverty Rate (census tract): 62.4 percent
Median Home Value (census tract): $64,000
2014 Shooting Victims (police district): 130
Philadelphia — City Averages
English Language Learners: 9.8 percent
Special Education: 14 percent
Adults reporting poor or fair health: 23.6 percent
Adults forgoing health care due to cost: 13.4 percent
Poverty Rate: 26.7 percent
Median Home Value: $143,200
Note on the data: The poverty rates and median home values come from the U.S. Census. All other figures are courtesy of the Mayor’s Office of Education.
Correction: A prior version of this article referred to the East Passyunk Avenue Civic Association. The correct name is the East Passyunk Crosing Civic Association. The story has been updated to reflect this change.
WHYY is your source for fact-based, in-depth journalism and information. As a nonprofit organization, we rely on financial support from readers like you. Please give today.
