


Mapping out patterns for why some PA towns give up their local police forces
")
An ever-increasingly large share of Pennsylvania’s transportation budget goes to state police. This year, state police will get around $773 million of the $2.8 billion motor license fund.* The state police’s share is expected to increase four percent this year. State police can rely on the Commonwealth’s transportation funds because that money is set aside for “safety on public highways”, and state troopers help keep PennDOT’s highways safe.
What the state troopers don’t get goes towards repairing and maintaining the Commonwealth’s crumbling bridges and highways. In 2013, Pennsylvania passed a new tax on fuels specifically to increase funding for highways and public transportation. After years of disinvestment, PennDOT and SEPTA are finally repairing and replacing old, decaying infrastructure.
But more and more state transportation dollars go to the state police. That’s because more and more Pennsylvania towns are giving up their own police forces and opting to rely on state police for coverage instead. For these localities, it’s a clever cost saving move — cut the town’s budget, passing the cost of stepped up state police coverage onto taxpayers statewide.
We at PlanPhilly were curious to learn more about the 1,295 municipalities that rely on state troopers full time, and the additional 417 that partially rely on state police. (Another 859 towns and cities have full time local police coverage; these figures don’t include university police forces like those at Temple University and the University of Pennsylvania).
So, we asked Eric Slaff, a local independent GIS analyst, to take a look at some of the characteristics of the towns that rely on state police to provide coverage.
Perhaps unsurprisingly, population density seems to play one of the biggest roles in a municipality’s decision to rely on state police or build their own force.
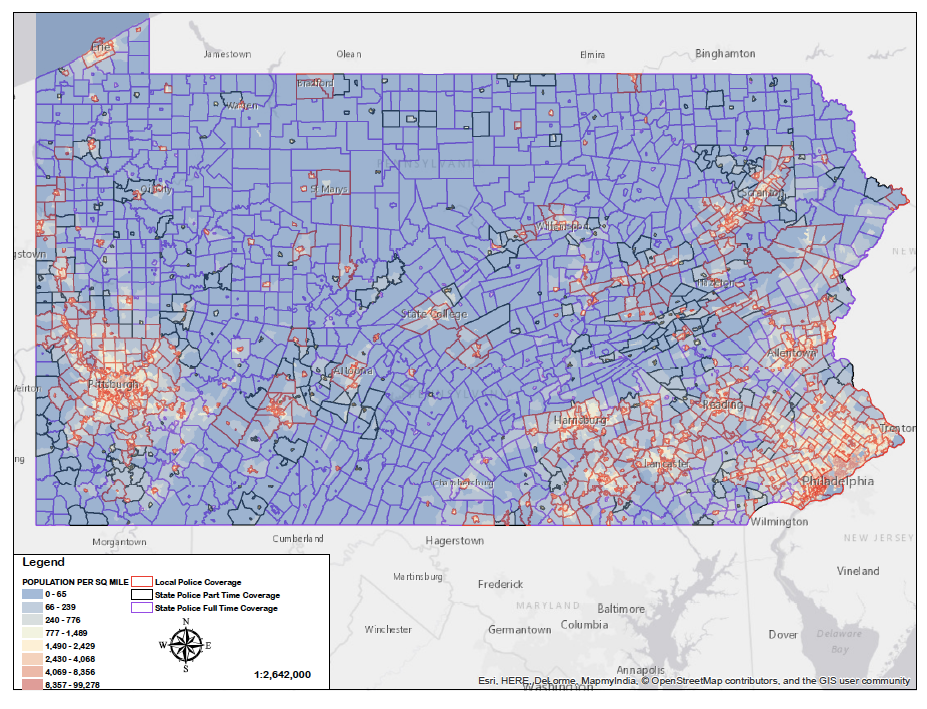
The darker, low-density jurisdictions tend to be ringed in purple, signifying full reliance on state police coverage. In contest, the lighter areas more often show red borders, signifying local police control. The black lines show part-time state police coverage.
Slaff also looked at median household income to see if wealthier jurisdictions were more likely to maintain their own police force.
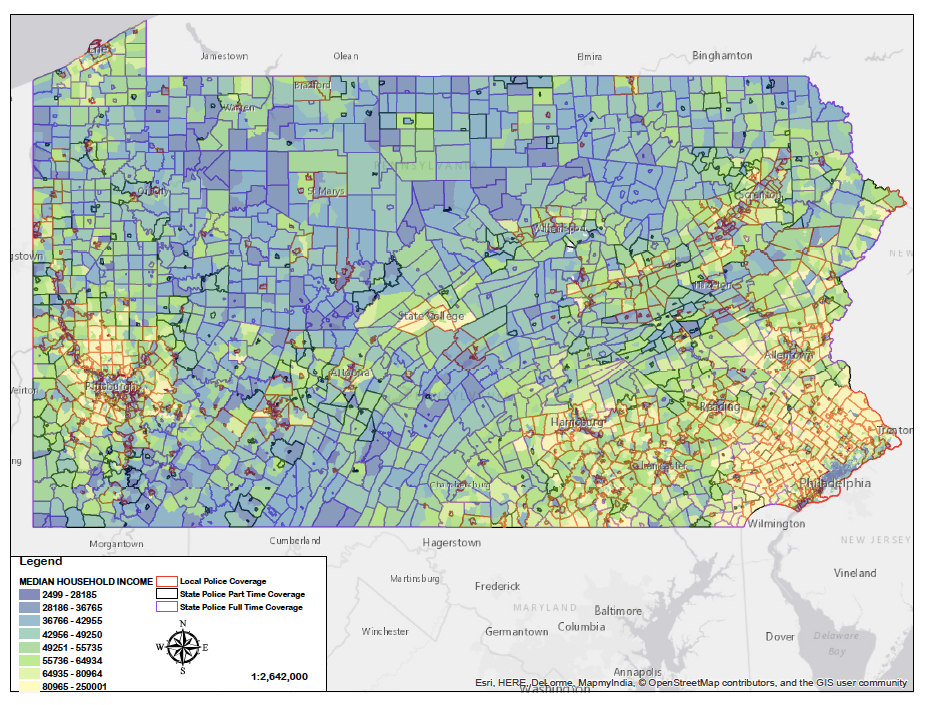
The variegated patterns produced on this map suggest there’s little correlation between the two. Some wealthier areas, shaded in lighter colors, rely on local police. But so, too, do some of the poorest areas, shaded in blues and greens. Many places that could afford local coverage still go without, and many places that seem to be hurting economically still pony up for local cops.
Perhaps the most revealing map is also the simplest, showing just which towns and cities rely on state police versus local.
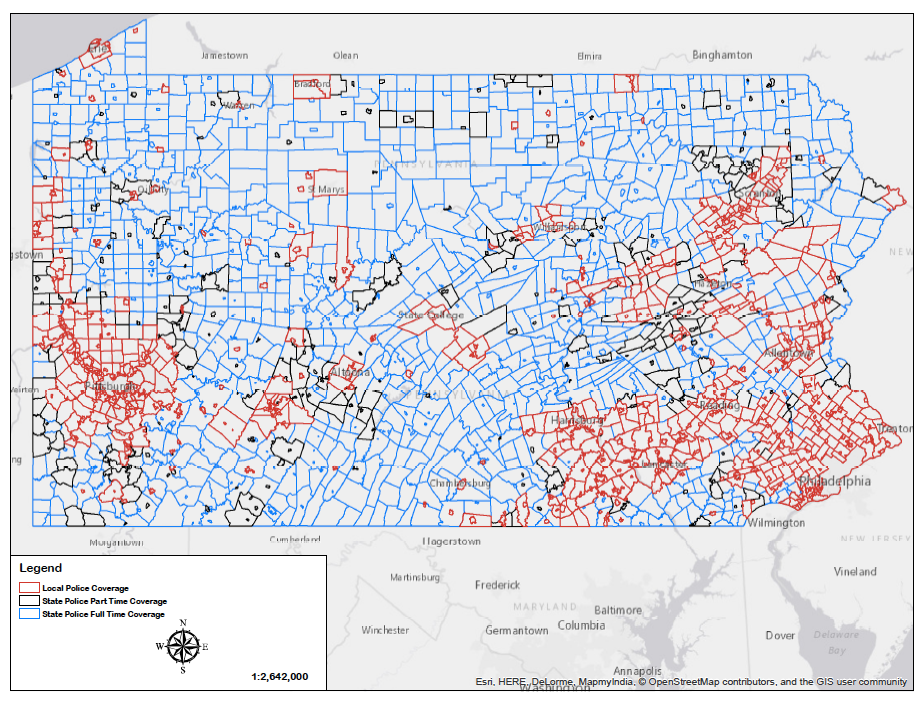
They group together geographically, across differences in population densities, political parties, and crime rates. It’s an epidemiological pattern — bordering another town that also has its own police force appears to be one of the biggest factors. The local control clusters start around Pennsylvania’s largest cities and continue into their suburbs — the areas surrounding Philadelphia, Pittsburgh, Allentown, Scranton, Reading, Harrisburg, Altoona and State College are lined in local-police red here.
The partial state police coverage areas similarly seem to cluster along the outside of the areas where locals patrol the streets. It may be simple civic pride that’s keeping more towns from abandoning their forces.
There may also be an element of local competition for residents at play — looking back at the population density map, many areas in the rural middle of the state that lighten up to show denser populations are also ringed in red or black. So either the relatively large towns in these areas feel a sense of civic obligation to maintain their own force or are using that force as a selling point for living in town — or both.
Crime data was only readily available in county-by-county breakdowns, making it impossible to draw any strong conclusions on the influence of crime rates on locality decisions to give up local police forces, but this seems to make little difference.
-

Crime rates per capita, county level, with municipal police coverage overlain. (Eric Slaff) -

Crime rates per capita, county level (Eric Slaff)
Relatively high crime Philadelphia has its own police force, along with most of Delaware and Allegheny Counties. But that’s true of low crime Chester and Lancaster Counties, too. And relatively high crime Fayette and Bradford Counties are mostly covered by state police.
*UPDATE: This article originally said the state police were getting $755 million out of the motor licence fund. That was the figure in fiscal year 2015-16. This fiscal year, they are getting $773 million. In fiscal year 16-17, state police got $802 million. Act 85 of 2016 has initiated reducing the amount of motor license funds state police recieve over a 10-year period.
p.p1 {margin: 0.0px 0.0px 0.0px 0.0px; font: 11.0px Calibri} span.s1 {font-kerning: none}
If you’re interested in taking a look yourself, the excel sheet available for download below lists all of the Pennsylvania municipalities and whether they rely on local police or state police.
WHYY is your source for fact-based, in-depth journalism and information. As a nonprofit organization, we rely on financial support from readers like you. Please give today.
Brought to you by PlanPhilly

PlanPhilly
In-depth, original reporting on housing, transportation, and development.

How Trump’s rollbacks to vehicle mileage rules could impact Philly air quality
The Trump administration said it wants to make cars more affordable.
6 months ago
Listen 1:07
Pennsylvania’s budget is nine weeks late. Delaware County lawmakers are urging the Senate to reach a deal on funding SEPTA and schools before it’s too late.
9 months ago

Philadelphia’s mass transit cuts foreshadow possible similar moves by other agencies across U.S.
Reductions are also on the table at transit agencies in Dallas, Chicago, San Francisco and Pittsburgh.
9 months ago