

Delaware’s Smarter Balanced Scores: explained in 8 charts


(NewsWorks/FILE)
On Wednesday, Delaware released preliminary results from its new, statewide test – known as Smarter Balanced.
In other words, we just got hit with a hurricane of data.
It’ll take a long time (and perhaps a few hurricanes) to sift through all the numbers. And there are still more to come.
But the 8 charts and tables below should help you make sense of what these early results indicate – and what they don’t.
Delaware versus itself
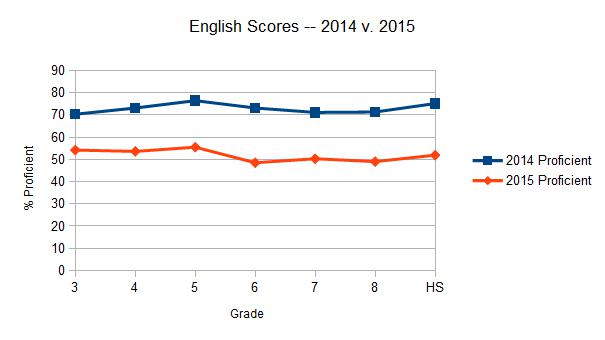
The above charts compare Delaware student performance on the 2014 Delaware Comprehensive Assessment System (DCAS) to performance on this year’s Smarter Balanced test.
As expected, Delaware’s youngsters did a whole lot worse in 2015. The Smarter Balanced was supposed to be a tougher test that attempted to measure deep thinking skills associated with the Common Core State Standards.
The debate still rages on over whether Smarter Balanced actually measured those thinking skills – or whether those skills are even worth measuring. But the test was indisputably tougher.
Depending on the grade level and subject, students scored between 16 and 45 percentage points lower on the Smarter Balanced than they did on its predecessor, DCAS.
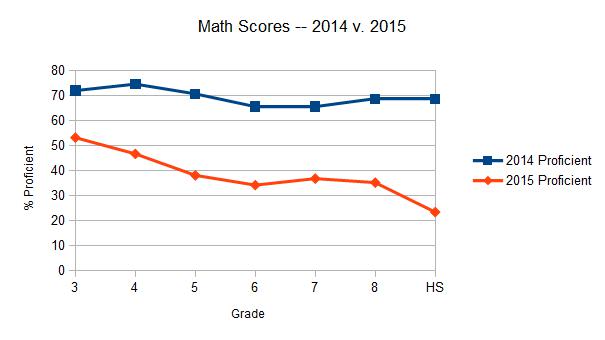
What’s interesting, though, are the trend lines.
On the English exam, there wasn’t much fluctuation but math was a different story. Student performance on the 2014 test was relatively steady between the grades. But in 2015, scores took a nosedive in late elementary school and again in high school.*
State officials offered two explanations for this.
1. Common Core mathematics is truly distinct from previous methods of math instruction. Common Core English, by comparison, is less of a pedagogical departure.
2. Younger students have been learning math using Common Core methods since they entered school. Older students have had to adjust midstream, which impacted their comprehension and ultimately hurt their scores.
If that hypothesis is true, we should eventually see those math scores even out. Time will tell.
* A quick note on the grade labeled “HS.” In 2014, Delaware tested 9th and 10th grades. In 2015, it only tested 11th graders. The 2014 “HS” number refers to how that year’s 10th-graders scored. The 2015 “HS” number refers to how this year’s 11th-graders scored. Ultimately, we’re talking about the same cohort of students.
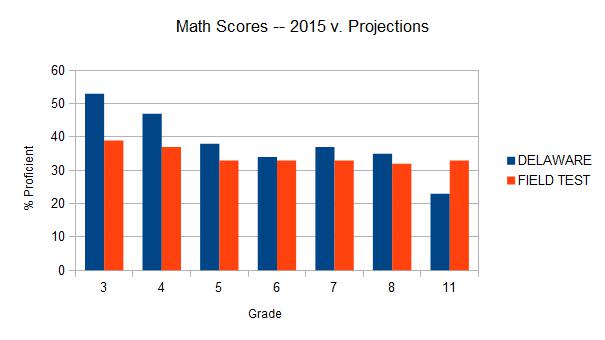
Delaware versus “the field test”
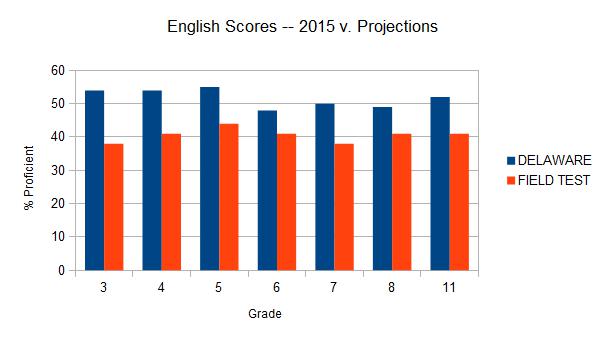
State leaders eagerly pointed out in a press briefing that Delaware out-performed projections on the first Smarter Balanced assessment.
So what does that mean?
Last year, over 4 million students across 21 states took what’s known as a field test for the Smarter Balanced exam. Field tests don’t formally count, but test designers use them to establish scoring scales and create a baseline for what to expect when the real scores roll in.
As you can see from the chart above, Delaware students smashed the proficiency expectations drawn from last year’s field tests. In every category except one (11th-grade math), Delaware students outscored the projections.
This is good news. But it comes with a caveat…
Delaware versus the other states
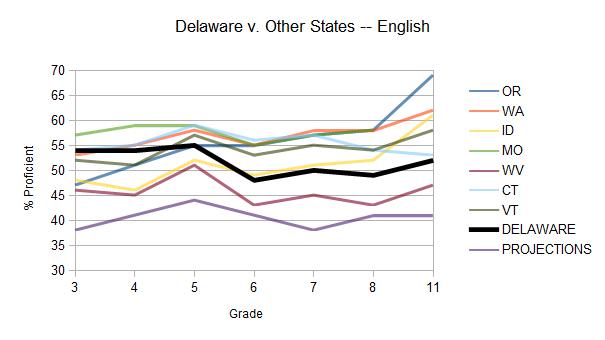
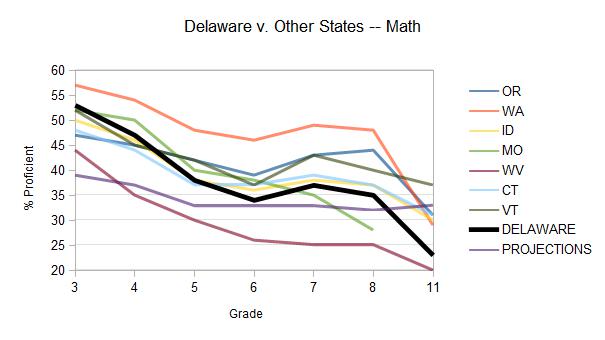
Yes, Delaware bested the Smarter Balanced projections. But as the above charts make clear, everyone is besting the Smarter Balanced projections.
Smarter Balanced was developed by a consortium of states and administered, in some form, by 18 of them last school year. One of the test’s advertised virtues was that it would allow states like Delaware to measure their progress against the progress of other states.
A lot of those states have yet to report their scores. So far, it seems that only seven others have reported results. It should be said, too, that a lot of these results, like Delaware’s, are preliminary projections that could change slightly.
The early scores do, however, indicate a couple things:
1. The projections were way, way low.
2. Lots of states struggled on math in the higher grades.
3. Delaware looks like it finished squarely in the middle of the pack.
As a whole, the First State did slightly better than average in the early grades, and slightly below average in the later grades. The large gap between Delaware’s early-grade math scores and its late-grade math scores stood out compared to other states. But it’s not as if anything else really jumps off the page.
Pessimists will want to focus on the first set of graphs, which show the big score drop from 2014 to 2015. Optimists will point to the charts that show Delaware smashing the Smarter Balanced projections.
In these charts, Delaware falls predictably in between and that’s likely where the truest interpretation lies.
The districts, ranked
| DISTRICT | ENGLISH % PROFICIENT | MATH % PROFICIENT | AVERAGE |
| Cape Henlopen | 62.1 | 52.2 | 57.2 |
| Caesar Rodney | 63.5 | 48.4 | 56.0 |
| Sussex Tech | 73.3 | 36 | 54.7 |
| Appoquinimink | 61.5 | 47.7 | 54.6 |
| Polytech | 77.8 | 29.8 | 53.8 |
| Lake Forest | 57.4 | 43.9 | 50.7 |
| Indian River | 58.1 | 43.1 | 50.6 |
| Smyrna | 56.5 | 41.8 | 49.2 |
| Delmar | 56.9 | 41.1 | 49.0 |
| Brandywine | 54.2 | 41.6 | 47.9 |
| Milford | 50 | 39.3 | 44.7 |
| Red Clay | 49.2 | 38.3 | 43.8 |
| Colonial | 47.9 | 30.5 | 39.2 |
| Capital | 47.4 | 29.5 | 38.5 |
| NCC VoTech | 51.6 | 15.4 | 33.5 |
| Christina | 36.2 | 29.2 | 32.7 |
| Seaford | 37.6 | 26.3 | 32.0 |
| Woodbridge | 34.2 | 29.1 | 31.7 |
| Laurel | 32.5 | 20 | 26.3 |
The above chart represents a crude–very crude–ranking for how Delaware’s 19 public school districts fared on the Smarter Balanced test.
The method used for creating the rankings is simple. The percentage of students deemed proficient in math and the percentage of students deemed proficient in English was averaged across each district.
Naturally, this chart doesn’t account for demographics, poverty rates, prior performance, and about a million other things that could influence test outcomes. But as a basic measuring stick for how the various districts performed, it does the job.
One quick note: the New Castle County Vocational Technical District ranks poorly in comparison to other districts because all of the schools in this district are high schools. Given that high schools across the state did not score well in math, it should be little surprise that NCC Vo-Tech’s math scores are pretty ugly.
The “opt out” effect
| Grade and Subject | 2014 Participation Rate | 2015 Participation Rate | Percentage Point Change |
| 3rd Grade — English | 99.1 % | 98 % | -1.1 % |
| 3rd Grade — Math | 99.5 % | 97.2 % | -2.3 % |
| 4th Grade — English | 99.2 % | 97.5 | -1.7 % |
| 4th Grade — Math | 99.5 % | 96.9 % | -2.6 % |
| 5th Grade — English | 99.2 % | 97.2 % | -2 % |
| 5th Grade — Math | 99.5 % | 97.0 % | -2.5 % |
| 6th Grade — English | 98.8 % | 97.9 % | -0.9 % |
| 6th Grade — Math | 99.1 % | 97 % | -2.1 % |
| 7th Grade — English | 98.8 % | 97.4 % | -1.4 % |
| 7th Grade — Math | 99.0 % | 96.5 % | -2.5 % |
| 8th Grade — English | 99.0 % | 97.2 % | -1.8 % |
| 8th Grade — Math | 99.1 % | 95.6 % | -3.5 % |
| HS — English | 95.1 % | 90.5 % | -4.6 % |
| HS — Math | 95.5 % | 89.3 % | -6.2 % |
In previous years when states release test results, participation rates typically don’t garner much attention.
Of course 2015 wasn’t a typical year for standardized testing in Delaware.
Throughout the spring, a legislative battle raged over whether parents should be allowed to withhold their children from standardized tests. The bill in question was ultimately vetoed by Governor Jack Markell, but many parents opted their children out of the Smarter Balanced test anyway.
How many?
Well the numbers above give at least some indication.
Participation rate measures – you guessed it – what percentage of eligible students participated in a given test. Between 2014 and 2015, participation rates on the primary state standardized test dropped in every grade and every test subject.
In many cases, the dips were modest – between one and two percentage points. But in the later grades, Delaware saw a significant drop off.
The Delaware Department of Education says it does not yet know how many of those non-participants were parent opt outs, as opposed to, say, truants. They also noted, pointedly, that the overall state participation rates were 96.7 percent for English and 95.8 percent for Math. That’s above the 95 percent minimum threshold established by the federal government and worlds away from states such as New York, where roughly a fifth of students opted out.
All that said, opt out had a clear and consistent effect across the grade levels.
So, what’s next?
All the data above is preliminary, but don’t expect the figures to change much. The Delaware Department of Education will issue a more detailed report on this year’s test scores at a State Board meeting later this month. At that point, we’ll see how various demographic subgroups performed on Smarter Balanced.
And a final word for parents: The state said individual student score reports should arrive around the week of September 20. Those reports will let you know how your child performed on Smarter Balanced. To check out a sample report, click here.
WHYY is your source for fact-based, in-depth journalism and information. As a nonprofit organization, we rely on financial support from readers like you. Please give today.