


Chart: South Philly home prices are taking off

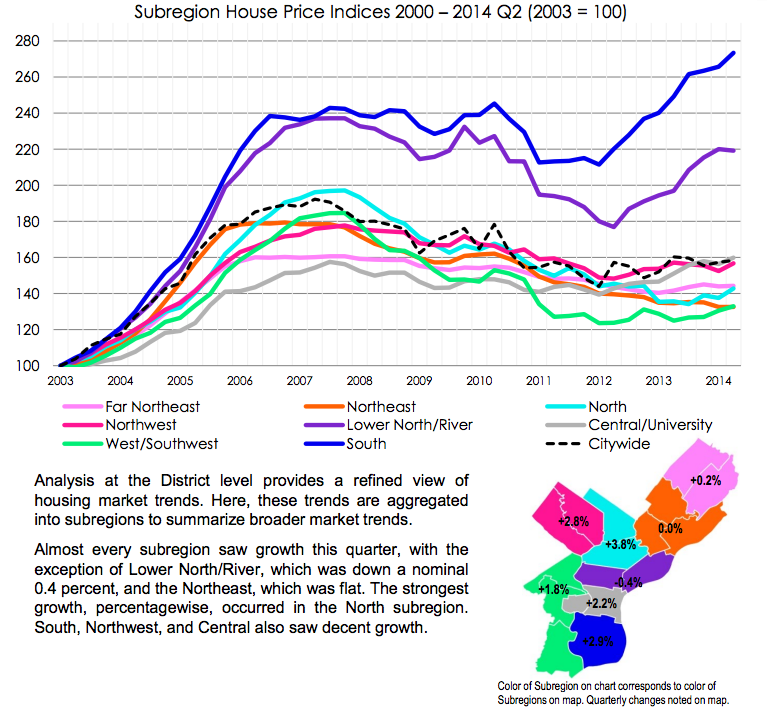
One chart worth pulling out of the Econsult report Jared Brey covered yesterday is this one, with the price trends for different subregions.
In the second quarter we saw the Lower North and river wards leveling off a bit, but South Philly prices continue to climb upward in Econsult’s index.
Why do you think the development frontier has been moving south faster than it’s been moving north since 2007?
WHYY is your source for fact-based, in-depth journalism and information. As a nonprofit organization, we rely on financial support from readers like you. Please give today.
Brought to you by PlanPhilly

PlanPhilly
In-depth, original reporting on housing, transportation, and development.