Census error wrecks 2017 Philly data on poverty, income
The U.S. Census Bureau identified a massive error in data on Philadelphia’s populace in 2017, including aspects of poverty, income, employment, and health insurance.

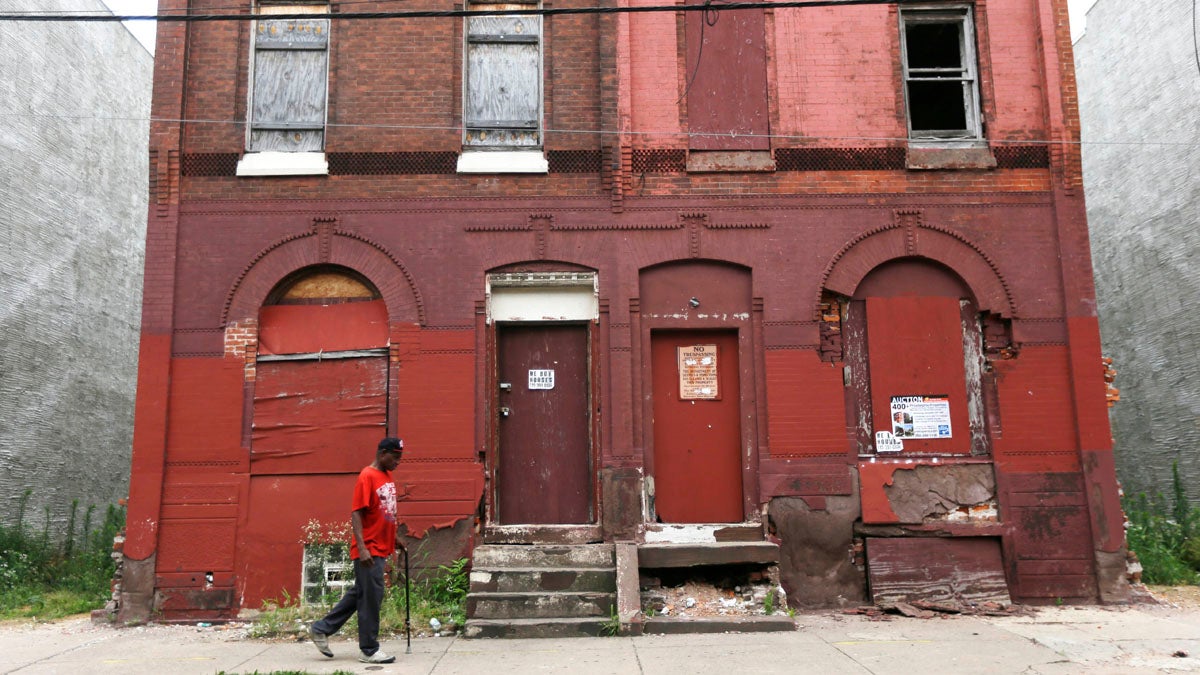
A man walks through a blighted neighborhood in Philadelphia. (Matt Rourke/AP Photo)
This article originally appeared on The Philadelphia Inquirer.
—
Somehow, it all went wrong.
On Wednesday, the U.S. Census Bureau explained that it identified a massive error in data it collected on Philadelphia’s populace in 2017, including aspects of poverty, income, employment, health insurance, rent, and more.
The bureau now has issued a statement on how we should regard all those 2017 statistics and numbers in its American Community Survey (ACS) released in September 2018:
Never mind.
Here’s how it works, or should:
Every year, the Census Bureau, which conducts the famous 10-year count of Americans known simply as The Census, also puts out the lesser-known ACS. In reams of figures, it tells the story of who we are, and how we’re living. It’s the biggest household survey in America after The Census, according to John Iceland, professor of sociology and demography at Pennsylvania State University.
In 2017 alone, residents of 2.1 million U.S. houses and apartments were contacted and interviewed by 3,820 interviewers for information, according to Iceland and a Census Bureau spokesman. In Pennsylvania, people living in 108,450 residences were contacted and interviewed, either by phone or in person, Iceland added. Philadelphia residents answered the questions of 68 interviewers for the ACS in 2017, the Census spokesman said.
Governments, antipoverty advocacy agencies, and private firms use the numbers to plan their years and figure out how to allocate resources based on changes in poverty, health insurance, employment, family size, rent payments, and other factors. It is, the Census Bureau tells us, “the premiere source for detailed population and housing information about our nation.”
Each survey looks backward at the previous year to compare how numbers rose or fell, thus teasing out trends and changes.
The 2018 survey, then, described life in 2017. This year, when the 2019 ACS was released on Thursday, it looked at 2018. But because the 2017 data were bad, people reading the newest survey could not contrast information between 2017 and 2018.
When he first saw the 2018 numbers in comparison with 2017, economist Paul Harrington, director of the Center for Labor Markets and Policy at Drexel University, was suspicious.
“This is really hard for me to swallow,” he said.
For example, Harrington saw that the 2018 ACS said that the median household income in Philadelphia that year was more than $46,000.
Wait, Harrington said to himself. The 2017 ACS said that the median income was $39,000.
Median household income zooming from $39,000 to $46,000 in a year was too big a change. “There are no quantum leaps,” he said. “Only coding errors.”
Ira Goldstein, president of policy solutions at the Reinvestment Fund in Philadelphia, said that he first made the Census Bureau aware of problems with the 2017 numbers in July 2019, after he saw bizarre discrepancies in statistics on the incomes of people who rent apartments.
The bureau spokesperson confirmed that. He said that such errors are rare and that this one occurred when a “field representative improperly collected data for Philadelphia County.” He didn’t elaborate.
An error in census data happened once before in Philadelphia. In 2009, city officials challenged the Census Bureau’s population estimate for the city, saying it was too low by about 90,000 residents. Eventually, the bureau agreed and restored the population.
It’s not yet clear how the error affected decisions. Goldstein said that because the 2017 numbers showed such low income figures, “we may have gotten too much money from the federal government in block grants.”
In retrospect, everything makes sense to people who had been baffled by the 2017 findings.
“There were strange numbers on the number of white people in poverty increasing dramatically between 2016 and 2017,” said Temple University sociologist Judith Levine.
And Kathy Fisher, policy director of the Greater Philadelphia Coalition Against Hunger, said that she had noticed precipitous drops in the number of children in poverty, which didn’t jibe with what she knew to be true.
City officials initially howled when they saw the $39,000 figure for median household income in 2017. They felt it was way off.
Economist Mark Zandi of Moody’s Analytics recalled being confounded by that figure, saying in September 2018, “I’m having a hard time getting my head around this.”
On Wednesday, Zandi smiled and said, “I feel vindicated. If something doesn’t make sense, then it doesn’t make sense. That’s a good rule.”
 The Inquirer is one of 21 news organizations producing Broke in Philly, a collaborative reporting project on solutions to poverty and the city’s push toward economic justice. See all of our reporting at brokeinphilly.org.
WHYY is your source for fact-based, in-depth journalism and information. As a nonprofit organization, we rely on financial support from readers like you. Please give today.


