


Azavea and PlanPhilly map Philly’s most dangerous intersections for pedestrians

Since 2008, the number of Philadelphia pedestrians hit by cars has held steady at over 1,700 per year.
The exact number has jumped around a bit from year to year, but what’s important to know is that the numbers aren’t falling. The toll actually increased in 2013 (the most recent year we have data for) to 1,773, up from 1,751 in 2012. There were 37 pedestrian deaths in 2013, and 195 total since 2008.
Pedestrian safety has become a big political issue in many of our peer cities in recent years, with Bill DeBlasio making Vision Zero a signature issue, and Mayors in San Francisco, Chicago, and Seattle taking up the cause as well. Jim Kenney was the first Mayoral candidate to make an issue out of it here, and it looks like other candidates may follow.
Last year Azavea’s Daniel McGlone and I flagged some of the biggest problem areas in Philadelphia in a piece for Next City and some follow-up blog posts at This Old City. This year, we’re updating that work here at PlanPhilly, with a special focus on the politics since this is campaign season.
The political context is that in recent years, the 10 District members of City Council have been voting themselves an increasing amount of power over street designs and the distribution of right-of-way between different types of street users in their districts. Bill Greenlee is blocking the 22nd Street bike lane and Washington Avenue restriping has turned into a neighborhood political drama in the 1st and 2nd Council Districts.
But with great power comes great responsibility, and it’s only fair then that the power grab should entail some accountability for Councilmembers who allow dangerous street designs to persist unaddressed in their districts.
So when you use the interactive map below, not only will you see which intersections and street segments caused the most problems between 2008 and 2013, you’ll also see which District Councilmember you can ask to do something about it. Hover over any area and you’ll see which Councilmember is in charge there, and then click on a dot to see how many pedestrian crashes occurred there. Dots outlined in purple indicate a fatality.
Click here for the big version.
Today we’ll show you 10 of the most dangerous intersections for pedestrians across the whole city. And next week we’ll show you the most dangerous intersections in each of the 10 City Council districts, along with some tables on the 10 most dangerous intersections within each District.
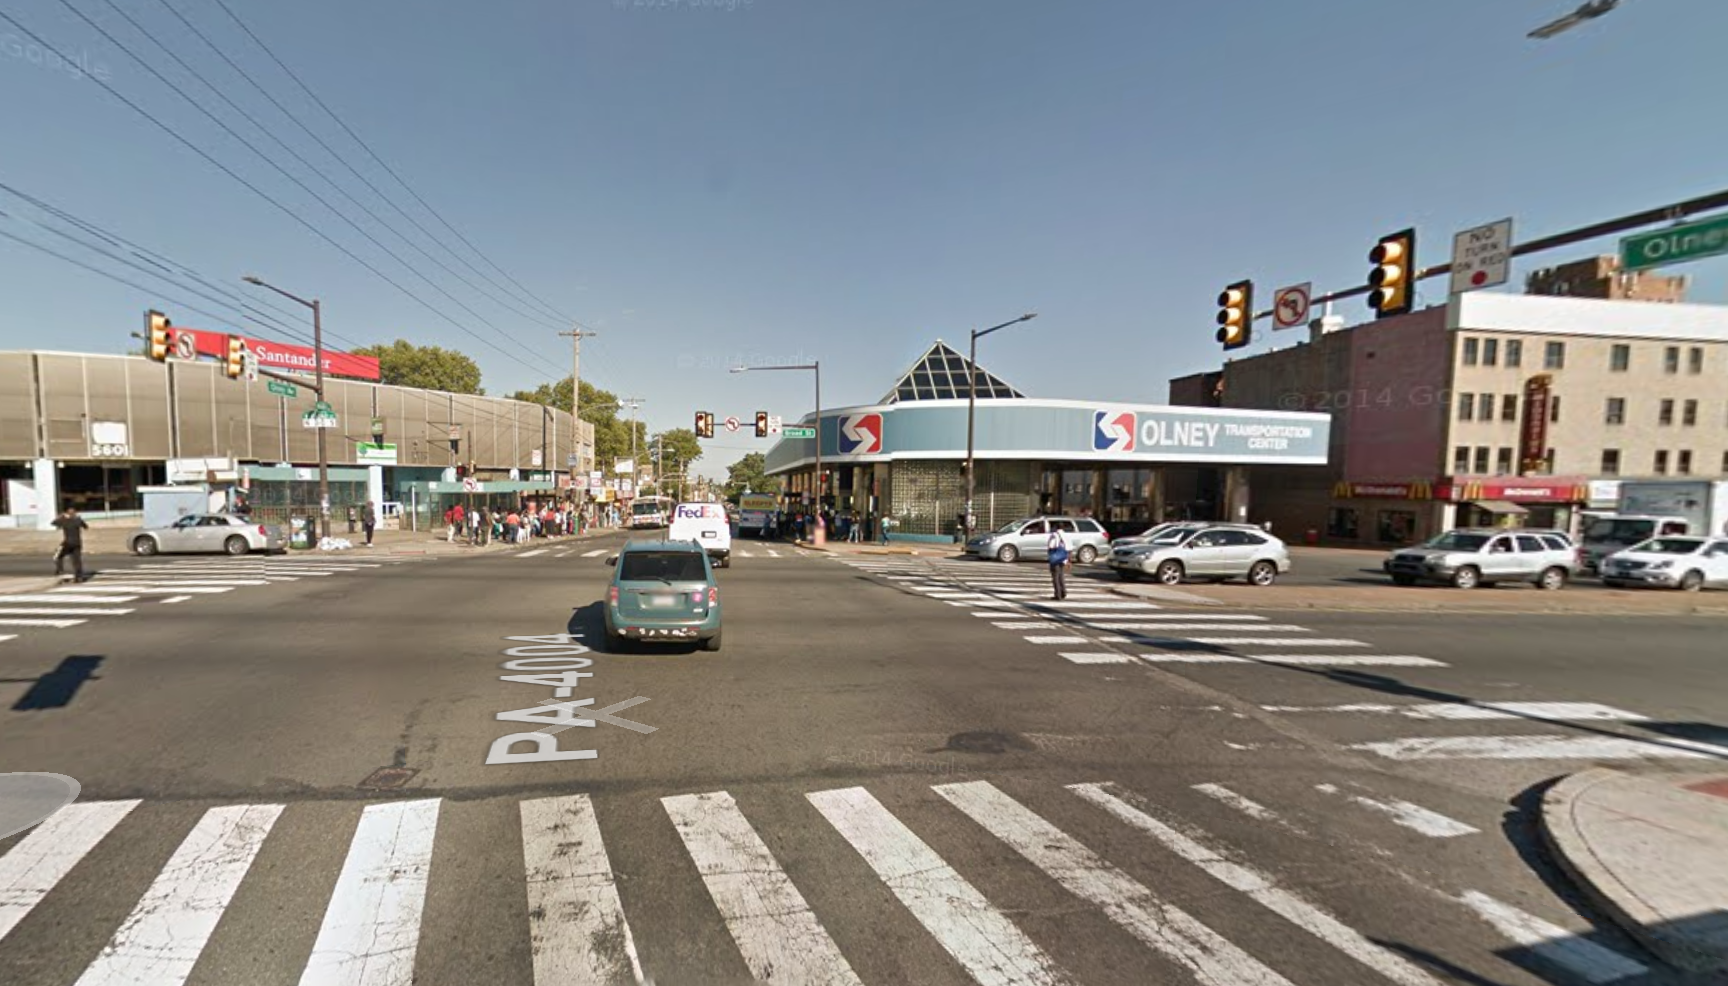
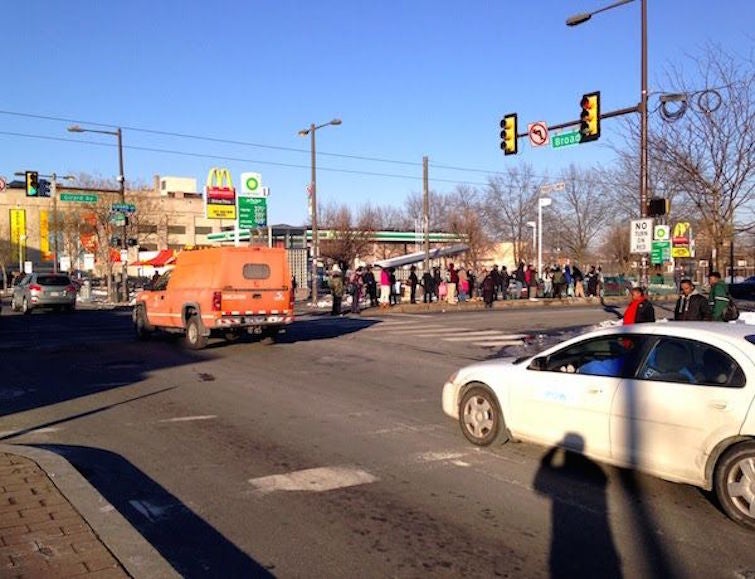
Broad and Olney
Nine of the top 25 most dangerous locations for pedestrians are on Broad Street, and Broad and Olney is the worst culprit, with 20 pedestrians struck by cars there between 2008 and 2013.
As is the case for all of the Broad Street locations on the top 25 list (Olney, Race, Snyder, Lehigh, Girard, Arch, Chew, Cecil B. Moore, and Susquehanna,) most crashes happen at the intersections, rather than mid-block. At Broad and Olney, 15 of the crashes took place at the intersection, and 5 were mid-block crashes.
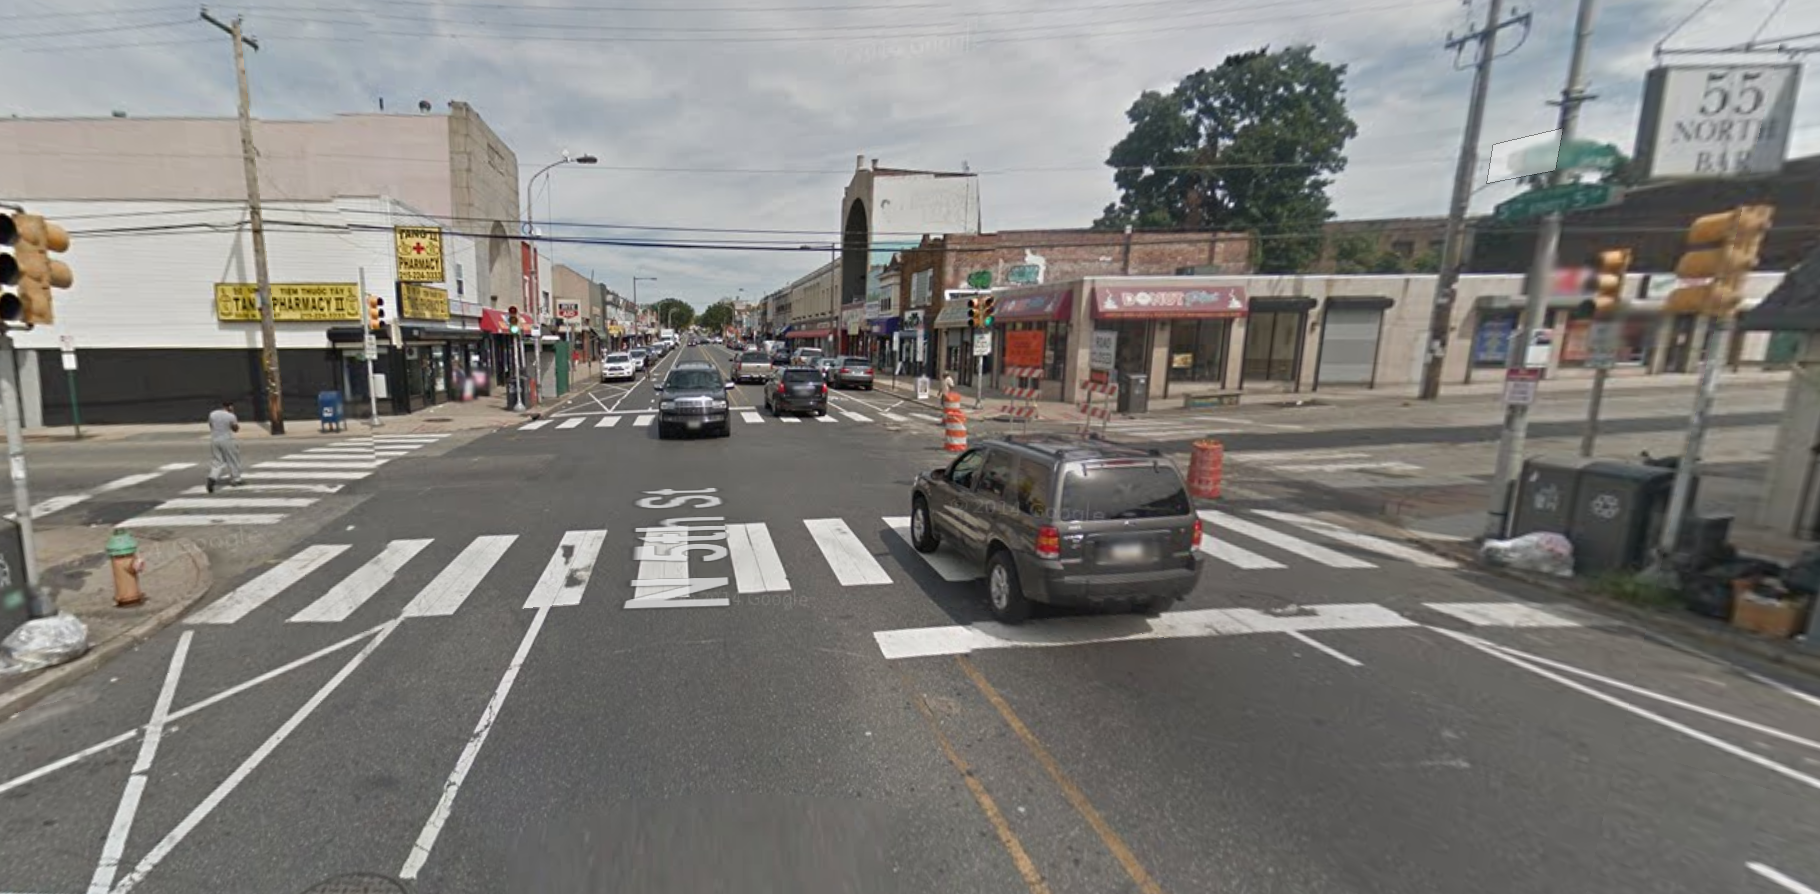
5th and Olney
The area with the highest pedestrian crash total between 2008 and 2013 is 5th and Olney, which was the site of 25 collisions. Seventeen of the collisions occurred in the intersection and 8 occurred mid-block.
Another thing to keep in mind about this map is that all of these crashes were serious enough to warrant filing a police report. PlanPhilly transportation reporter Jim Saksa got hit by a car on his bike the other day (he’s fine) and he didn’t report it, and we have to imagine there are lots of other unreported crashes, too. The Bicycle Coalition has flagged inadequate data collection on bike crashes as a factor that makes it hard to study the problem.
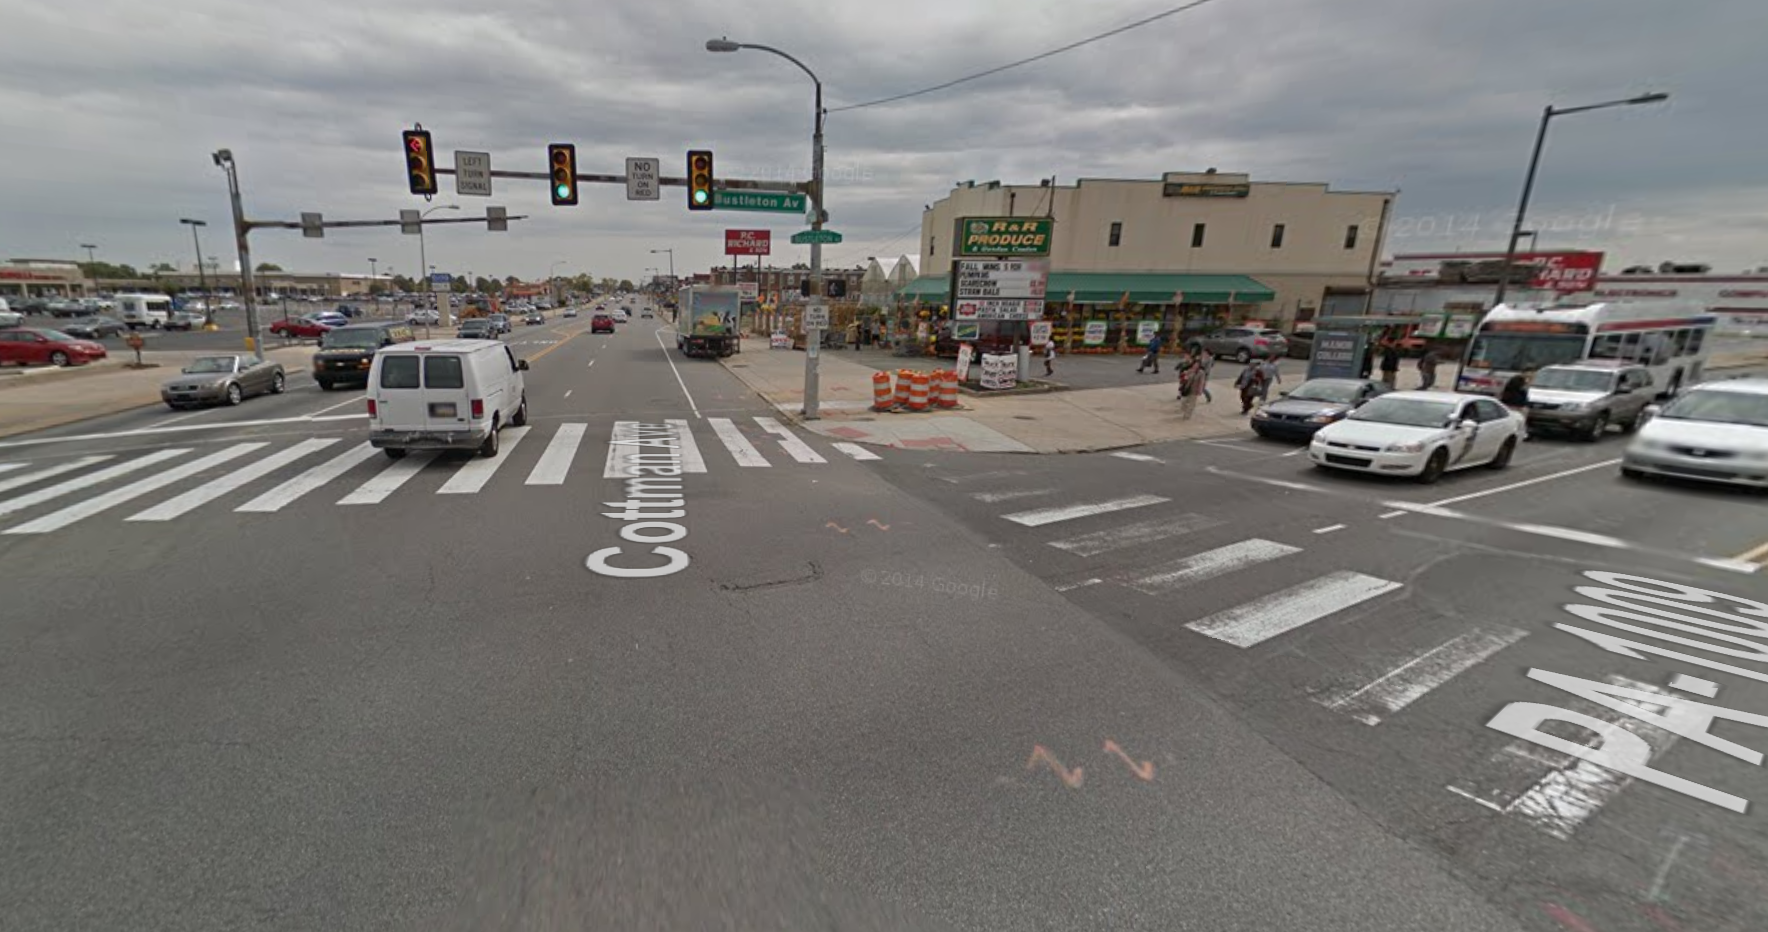
Cottman and Bustleton
This intersection near the Roosevelt Mall was the single deadliest intersection of 2013. There were 15 total pedestrians hit, with 8 of those collisions occurring in the intersection, 7 occurring mid-block, and three of those collisions resulting in fatalities.
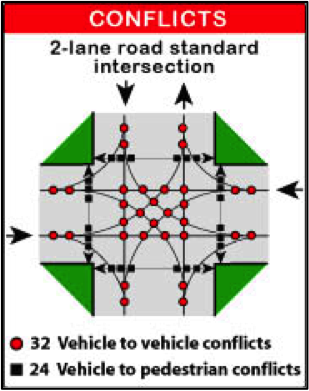
Cottman and Bustleton are both good examples of what Strong Towns writer Chuck Marohn calls a “stroad” – a mutant thoroughfare that tries to be both a street and a road at the same time, while failing at both objectives. As Marohn puts it, a street’s function is to provide a platform for productive private sector investment, and a road’s function is to move cars between two destinations. A stroad does neither of these things well, and it’s also one of the most dangerous types of street designs the American engineering profession has conceived of.
To make these streets less dangerous, the area’s political leaders have to decide which one of these things they want Cottman and Bustleton to be. The city recently received a federal TIGER grant to upgrade traffic signals on Bustleton Ave to improve traffic flow, but that’s not necessarily going to make the street safer for walking.
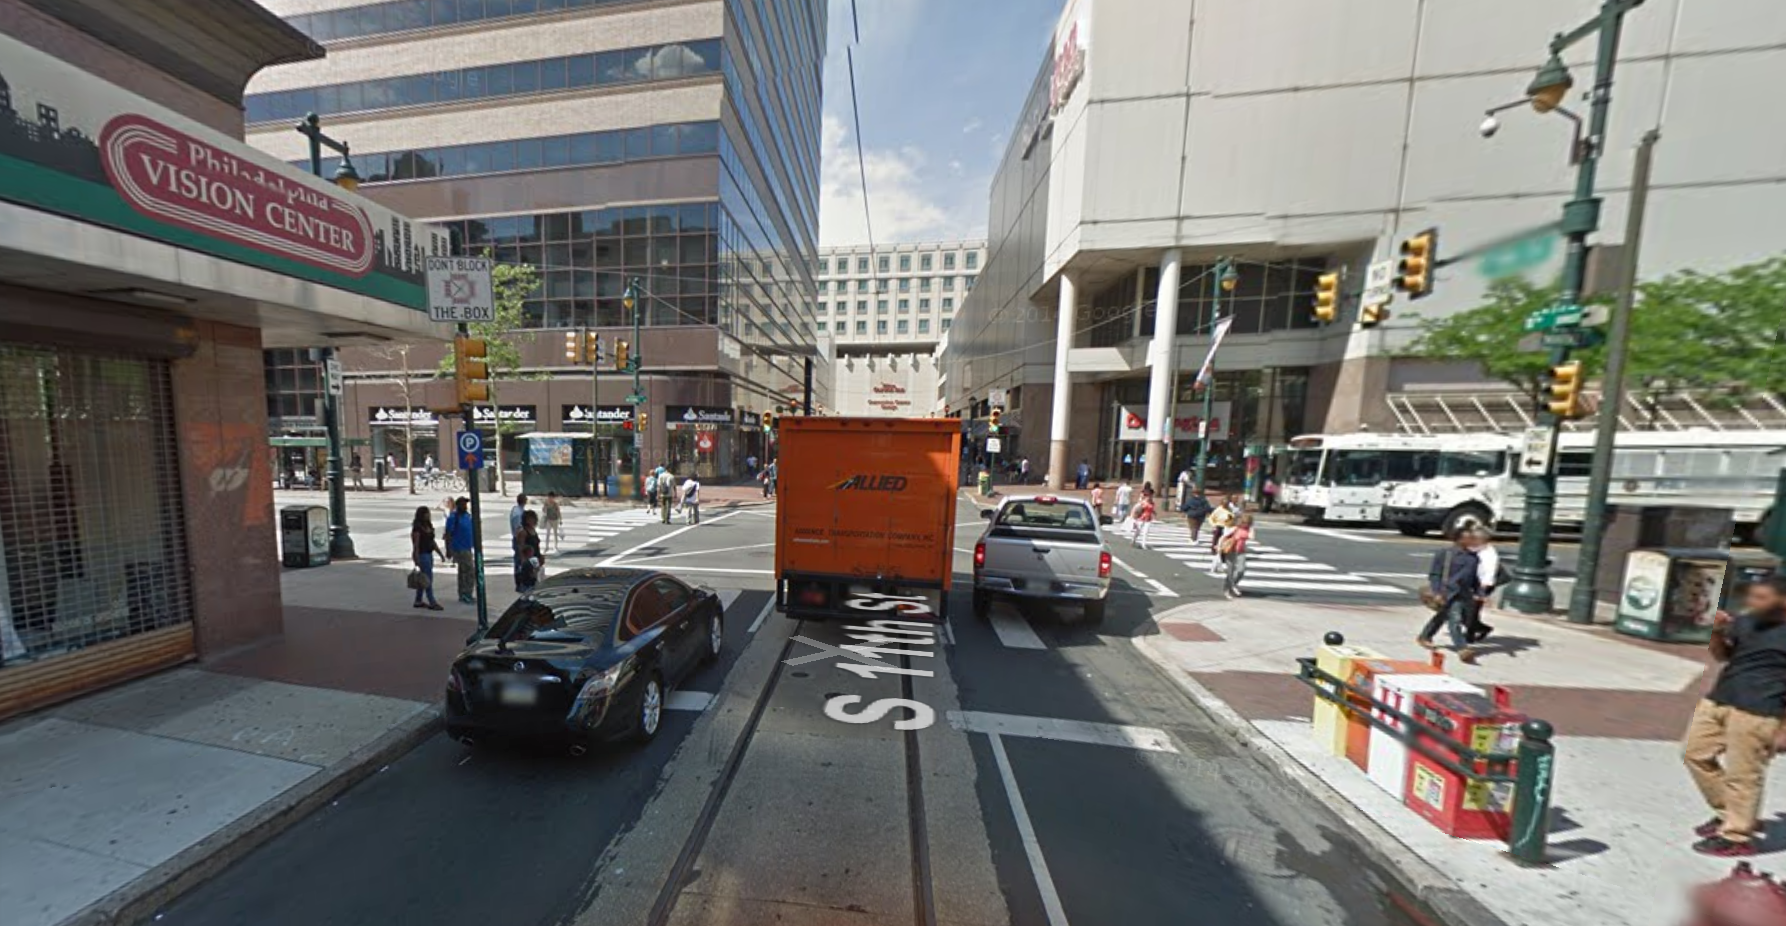
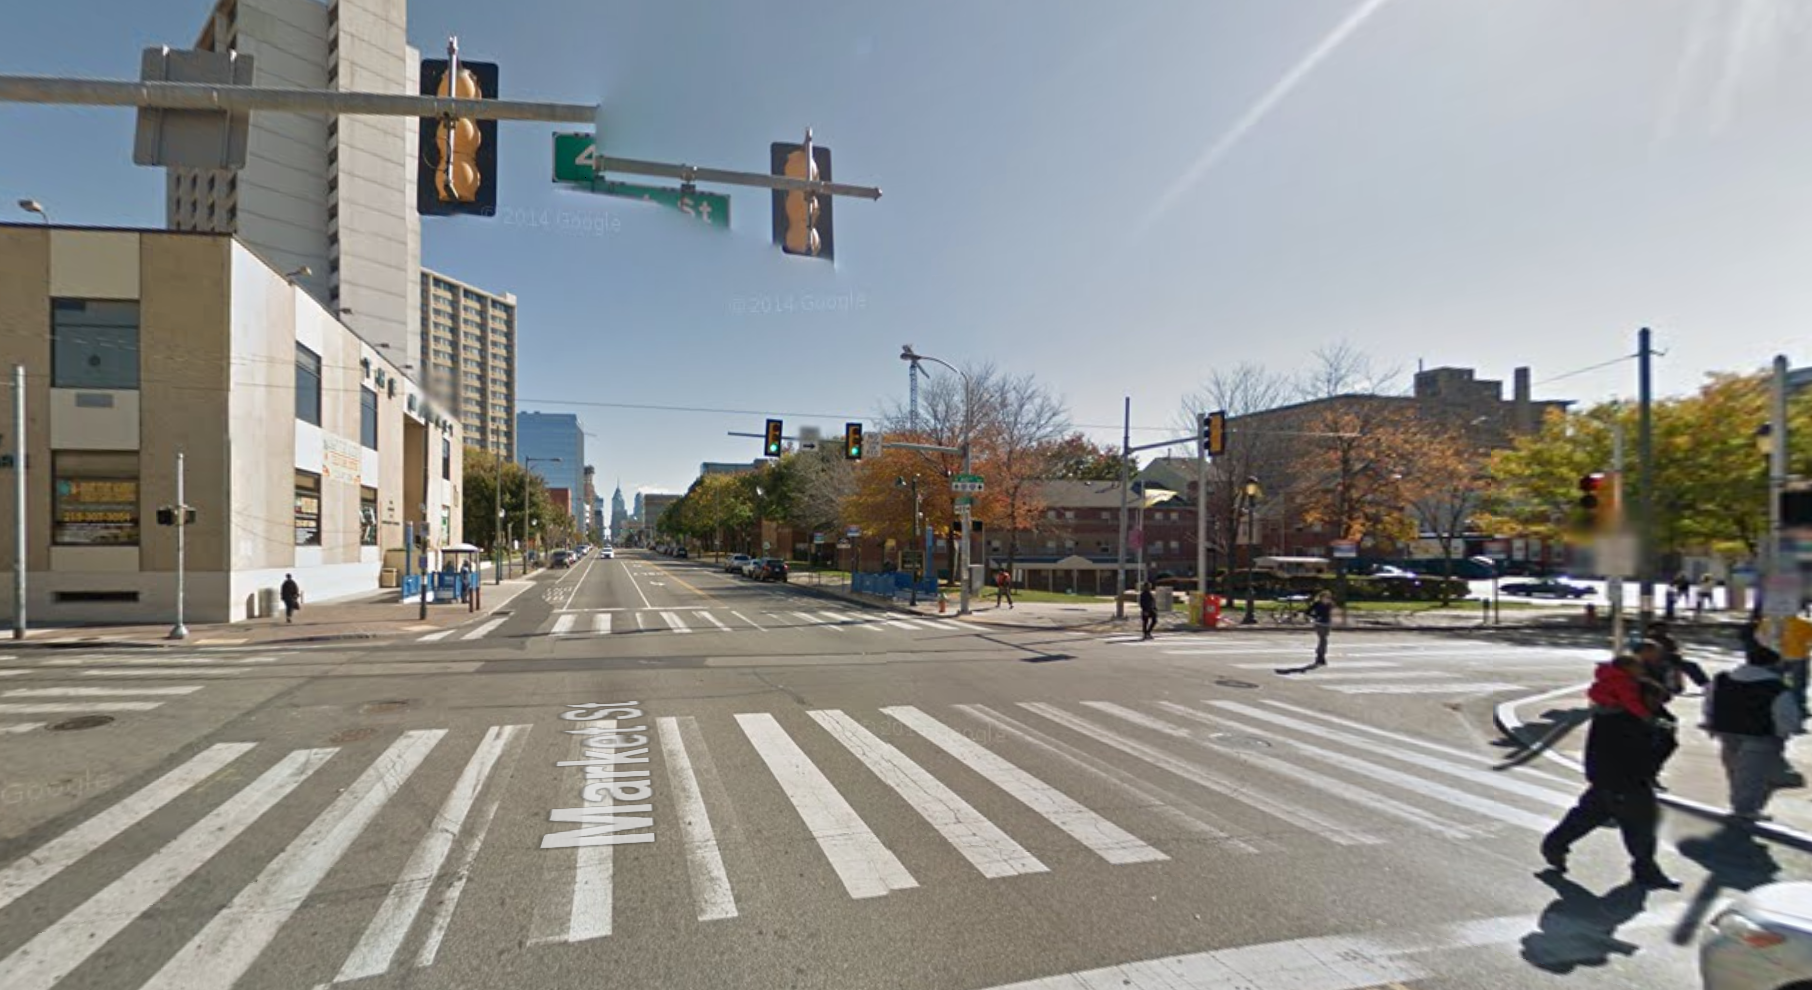
11th and Market
With all the residential and mixed-use retail action planned for this area, the pedestrian safety component is going to be crucial to get right. The 1100 East Market project will add hundreds of new residents to this block, and will be trying to emphasize its pedestrian appeal, at least on the privately-owned side of the property line. Its success in attracting foot traffic though will depend on people feeling safe walking on Market and crossing at the intersections.
The Gallery, which made my list last year as one of the most dangerous places for pedestrians, is still one of the most troubled spots, and the intersections at 8th, 9th, 10th, and 12th Streets all make the top 30 list of crash locations. With so many collisions on Market, might it be time to look at some mid-block safety islands in the NACTO urban street design guide?
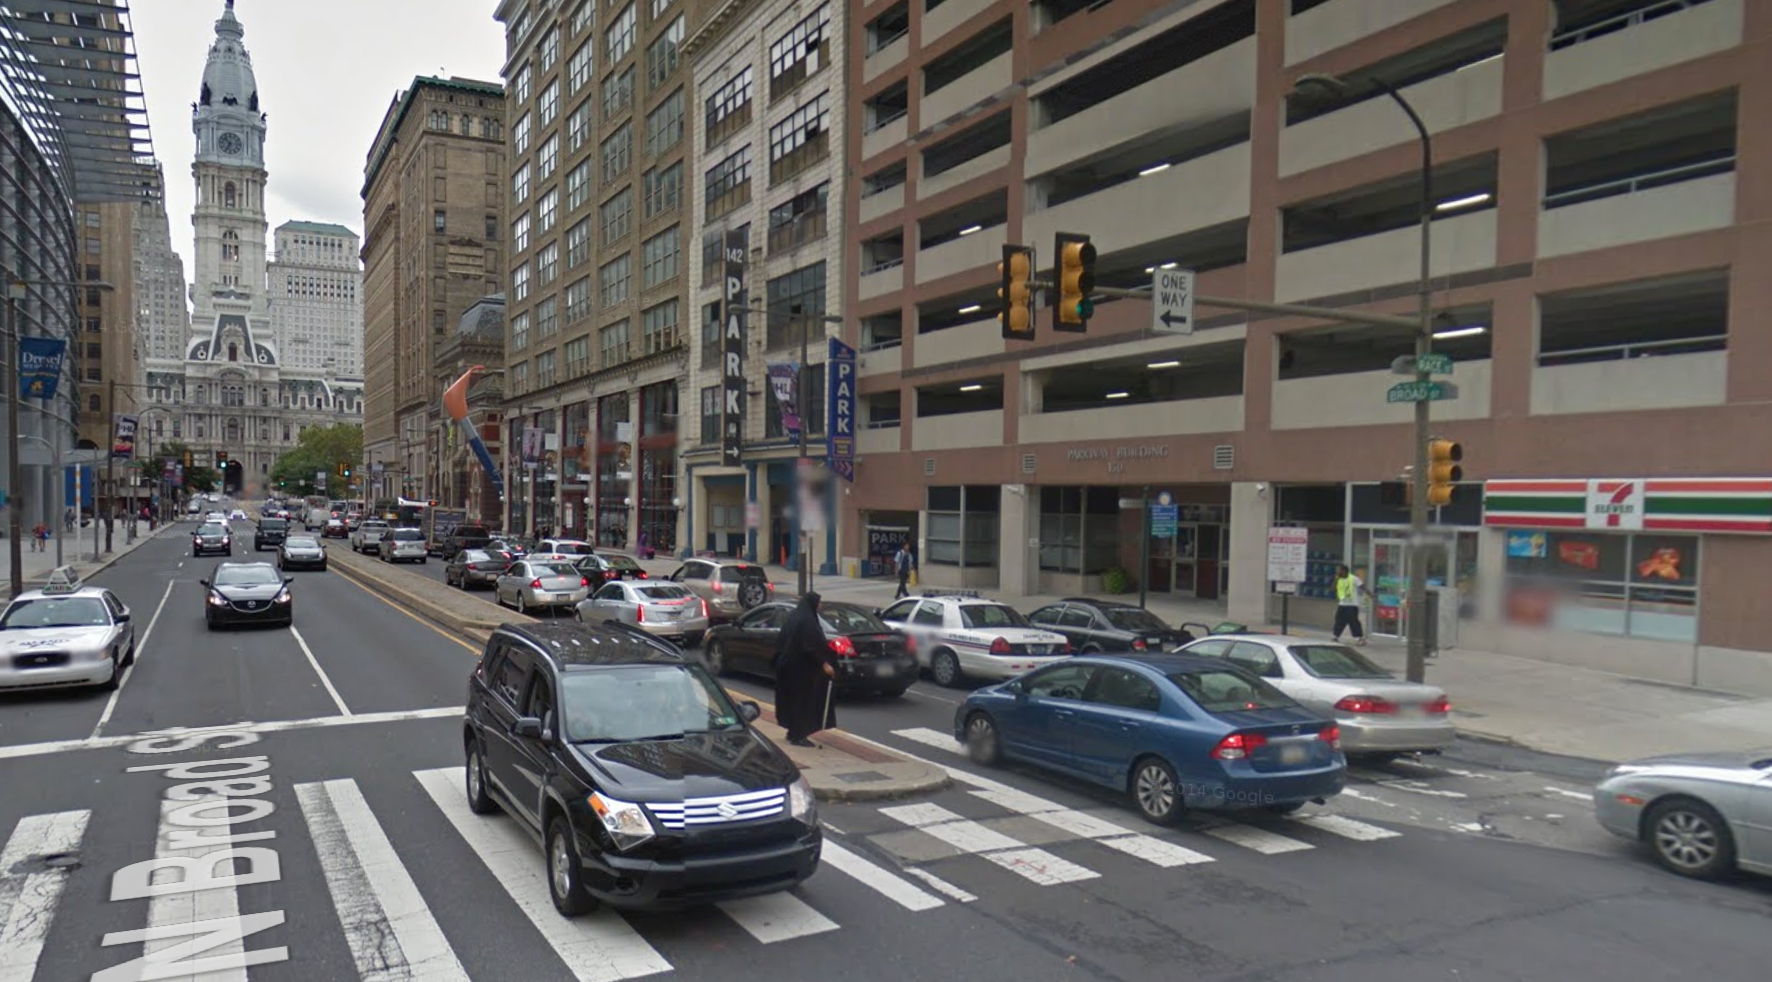
Broad and Race
How about this for a Google Streetview image find for this article?
The intersection at Broad and Race saw 13 crashes between 2008 and 2013, and there were 5 mid-block collisions, for a total of 18 in this area. As you can see in the image, the skinny medians aren’t providing much comfort for people walking in the area. Add in throngs of people in cars headed to I76, some pretty wide travel lanes, and the Race St BSL station nearby and you’re looking at a place that’s pretty inhospitable to pedestrians. There were another 16 pedestrian crashes at Broad and Arch during this period, a block away.
Broad and Girard
Just about the saddest thing you can see is the tiny sliver of a trolley platform at Broad and Girard so packed with people waiting for the trolley that the line actually backs up into the crosswalk. The very dangerous crosswalk.
Seventeen people were hit by cars between 2008 and 2013, all of whom were struck at the intersection, rather than mid-block.
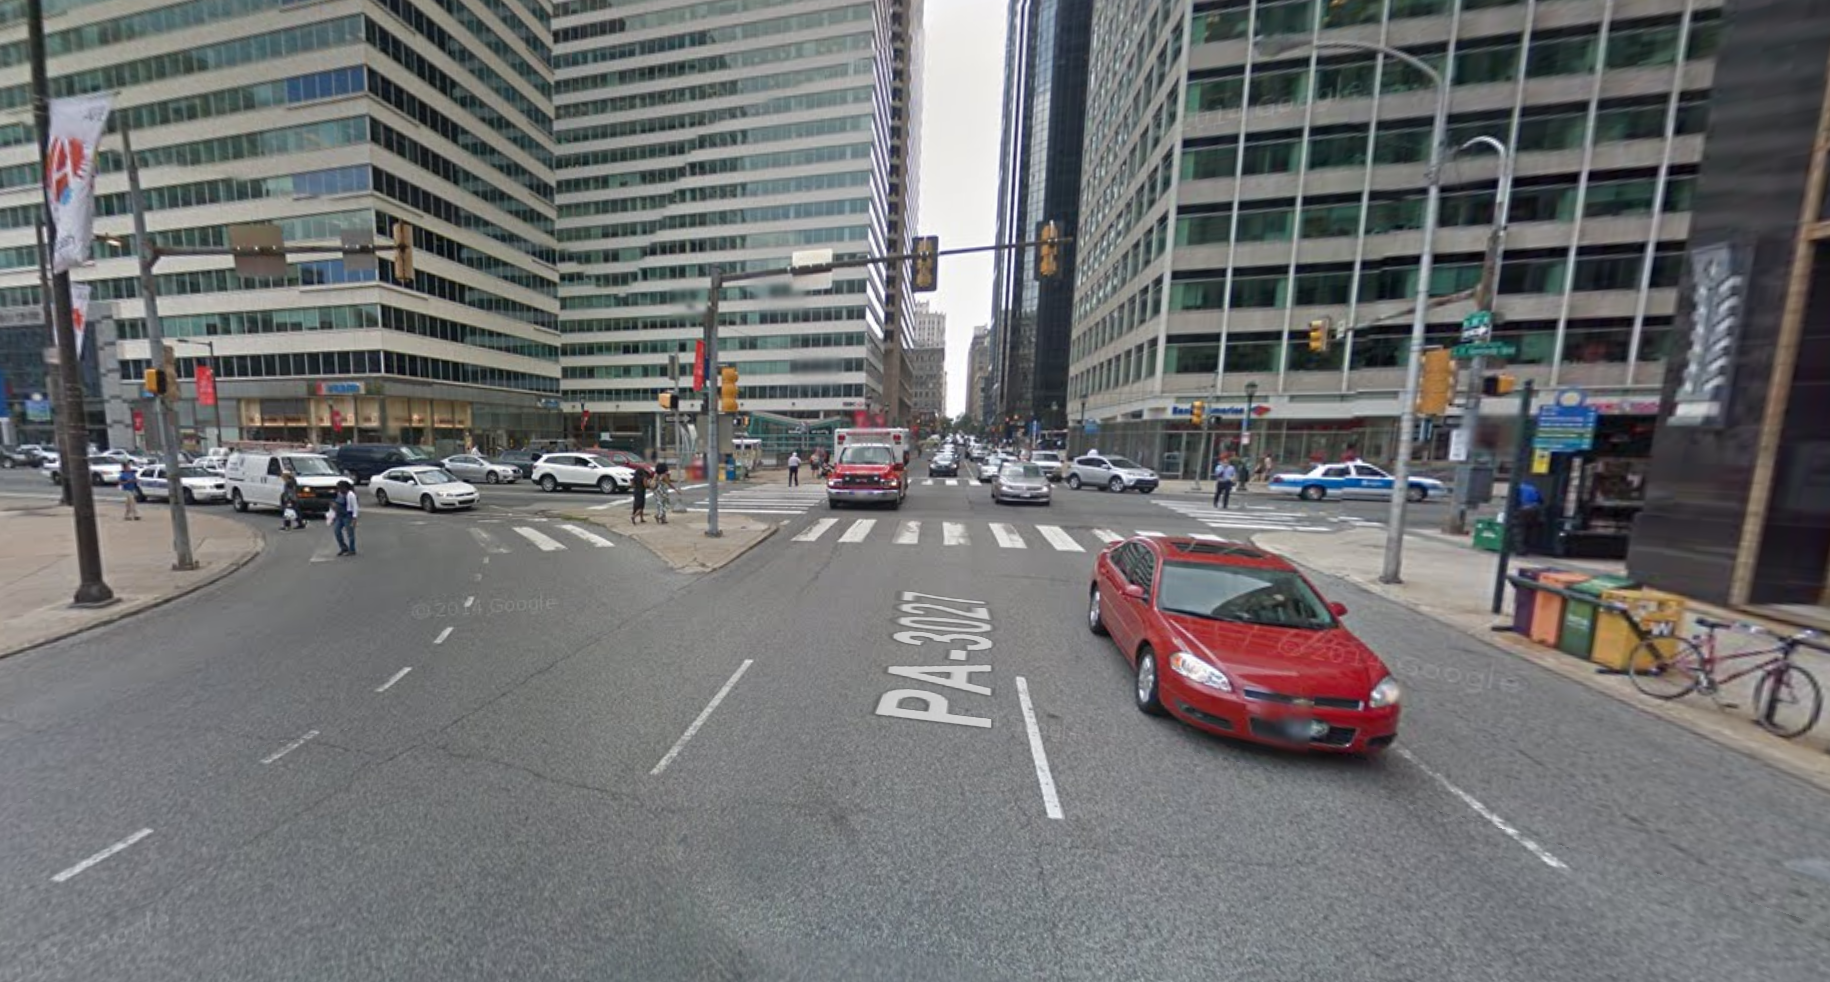
16th and JFK
Clearly a lot of thought was put into the redesign of Dilworth Park, and also the ongoing process for remaking Love Park. But to our knowledge, neither of those processes involved a serious rethink of what the public streets around the major Center City public plazas should be like, or what types of users they would serve.
No one has seriously challenged the conventional wisdom that the highest and best use for the public right-of-way in the vicinity of the municipal complex is a traffic sewer optimized for funneling solo-drivers into and out of the city during the two peak travel times on weekdays.
The Central District plan proposed some modest traffic calming ideas for this area, but to date, none of them have been built. As such, 15th and 16th Streets, JFK, and the Parkway remain over-engineered for off-peak times, allowing inappropriately fast speeds for an urban environment with lots of people walking around. Six pedestrians were hit right on 15th Street in front of what is now Dilworth Park between 2008 and 2013, 7 were hit at JFK and 15th, 10 were hit at Market and 13th, 10 at 16th and JFK, and 9 at 15th and Chestnut.
One hypothesis that came out of the aggressive driving hotspots map in last year’s analysis was that people are still in highway driving mode for a little while after they get off the highway and onto the urban street grid. The current design of 15th Street doesn’t try to acclimate people coming in off the highway to driving on narrow city streets until Chestnut, which has a ton of foot traffic.
40th and Market
The intersection at 40th and Market near the El stop in West Philly saw 15 crashes between 2008 and 2013, and there were two more in the general vicinity. Each of these streets is problematic on its own as well. There were another 6 crashes at 34th and Market, and another 6 at 32nd. And Walnut and Spruce each saw 7 crashes where they intersect with 40th Street.
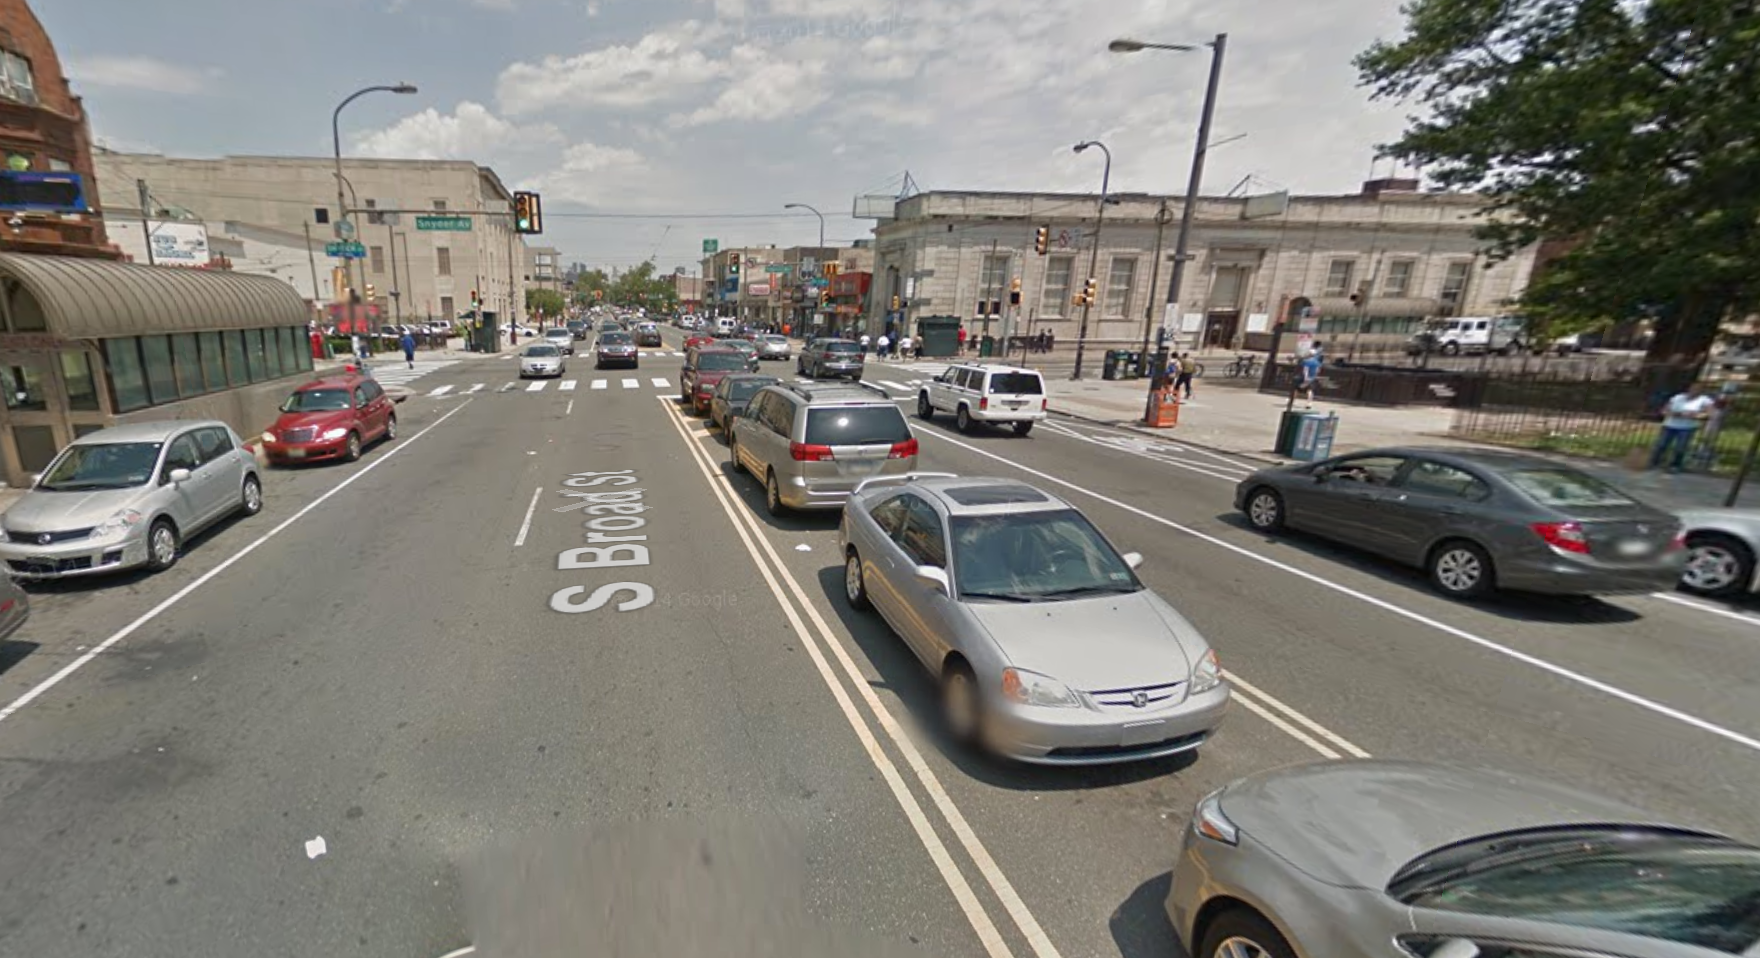
Broad and Snyder
Mayoral contender Jim Kenney endorsed a Vision Zero approach to pedestrian safety, but he also said he doesn’t want to start enforcing the ban on parking in the Broad Street median. He might have to rethink his views on Broad Street parking though, because it appears to contradict the first goal.
While most of the major pedestrian crash locations were centered around intersections, with fewer mid-block, Broad and Snyder was notable for the number of collisions that occurred mid-block. Of the 17 total crashes, 10 occurred at the intersection and 7 occurred mid-block. And as you can see on the map, as you get down to the area where the lax median parking enforcement starts, you start to see more and deadlier crashes occurring, though the absolute numbers are admittedly low.
Is that conclusive evidence? Hardly, but thinking about this intuitively, getting out of one’s car in the middle of Broad Street and crossing the street mid-block seems pretty dangerous. And to the extent that it obstructs clear lines of sight for people crossing at the crosswalk, that’s dangerous too.
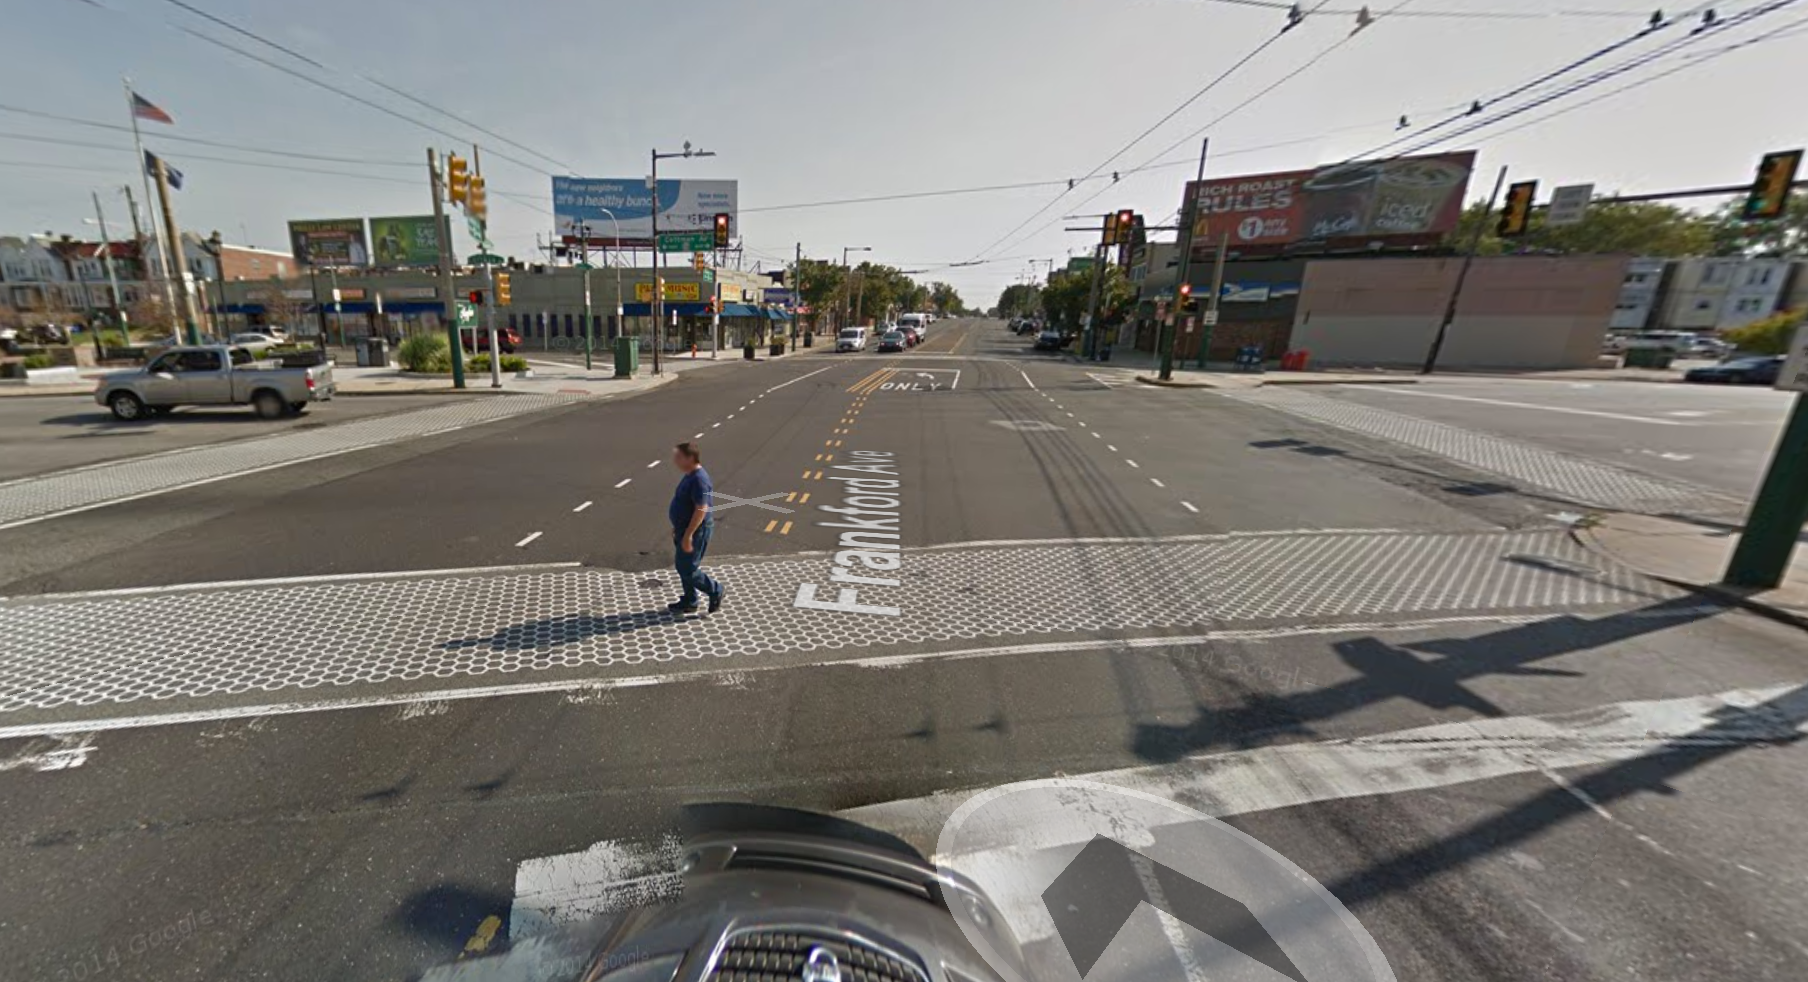
Frankford and Cottman
Even with the Google Streetview’s wide lens, you can’t take a shot of how wide this intersection is. Frankford, Cottman, and Ryan Ave. all come together here, increasing the number of potential conflict points, but to make matters worse Frankford Ave. bulges out into a full-blown stroad between Aldine and Wellington Sts. greatly increasing the amount of time pedestrians have to spend in the cartway when crossing the street. Most of the crashes seem to be occurring on Frankford Ave.
There were 15 total crashes here, 13 of which were in the intersection, and 2 of which occurred mid-block. Frankford and Cottman are both state routes, so improving this area for pedestrians will require PennDOT’s cooperation.
Come back Monday for the second installment, where we’ll show you the worst pedestrian crash location in each Council District.
WHYY is your source for fact-based, in-depth journalism and information. As a nonprofit organization, we rely on financial support from readers like you. Please give today.
Brought to you by PlanPhilly

PlanPhilly
In-depth, original reporting on housing, transportation, and development.