Heating problems in Philly schools rise as temperatures plunge
Philadelphia School District facilities workers have been on the job since Christmas to fix faulty heating units. It's a $70M problem.

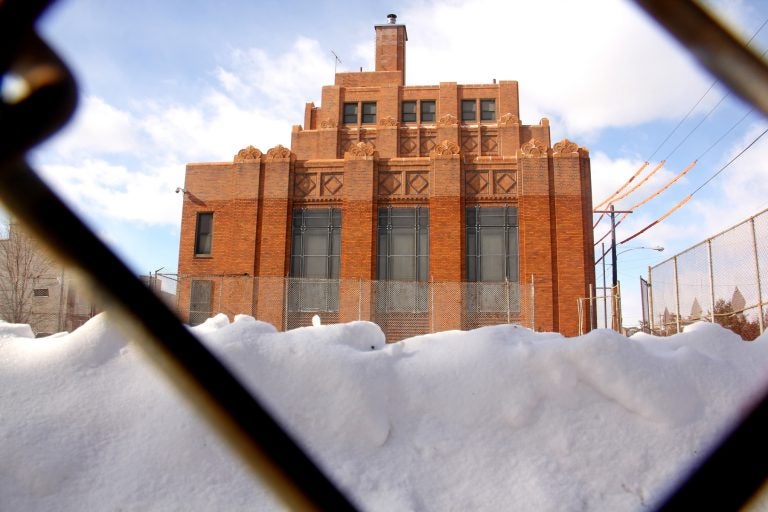
Spring Garden School is one of several schools whose outdated heating system would cost more to repair than to replace. (Emma Lee/WHYY)
With temperatures plummeting, facilities workers in Philadelphia’s public schools have dealt with a steady stream of weather-related maintenance issues.
“Our building engineers are working double time on this,” said school district spokesperson Lee Whack. “It gets cold every winter, but obviously not this cold.”
The region’s deep freeze has made life especially difficult for the district’s facilities team, which oversees an aging building stock on a limited budget. To replace all the heating systems the district says are on borrowed time would cost more than $70 million, according to a WHYY analysis.
Building engineers have worked every day since December 26th, including weekends, said Whack, to battle the creeping cold. Maintenance workers will be on the job through this weekend and are expected to arrive early Monday morning to detect any new problems.
“This is an all-hands-on-deck effort,” said Whack
At Solis-Cohen school in Northeast Philadelphia, heating issues prompted some students to move classrooms, as reported first by CBS3.
District officials also acknowledged heating problems at Overbrook Education Center, which serves a large number of visually impaired students, Strawberry Mansion High School, Mastbaum High School, and Nebinger School.
At Strawberry Mansion, two heating units froze and a boiler required repair, according to Whack. Overbrook Education Center had at least two classrooms without heat. Nebinger School dealt with overheating due to malfunctioning controls. Mastbaum, meanwhile, had problems with a temporary boiler.
Whack said problems at all five schools have either been fixed or are in the process of being fixed, and should be remedied by Monday.
Staff also reported cold conditions at Cook-Wissahickon School, according to Arthur Steinberg, who runs the health and wellness fund for the city’s teachers union.
Staff members at several city schools reached out to WHYY with tales of frigid hallways and drafty classrooms, though all asked to remain anonymous. One staffer at Tilden Middle School in Southwest Philadelphia said students in an autistic support classroom had to be moved because of the cold conditions.
Frigid temperatures in Baltimore schools prompted outrage after the city’s teachers union sounded alarms. There have not been widespread reports of similar conditions in Philadelphia.
Steinberg, however, said there was an uptick in complaints when teachers came back from winter break, and he expects more problems to crop up during the temperature plunge this weekend.
“I’m anticipating a lot of issues,” he said.
Thanks to vacation and snow days, Philadelphia students have been in class just one day since Dec. 22. That’s at least limited the disruption caused by poorly-heated buildings.
But school officials have not tried to hide the ongoing problems.
Last winter, the district released an outside analysis of its facilities that found $4.5 billion in deferred maintenance. The backlog will grow, analysts said, without further investment.
The district is already facing a structural deficit, and the state contributes less money to capital projects than it once did. Without new money from the city or state, the district’s capital woes are expected to grow.
The report assigned a facilities condition index — or FCI — number to each school that calculated the cost of needed repairs, divided by the cost to erect a new building. Buildings with an FCI over 60 percent, the analysts said, should be considered for closure or replacement.
Evaluators also assigned FCI scores to systems within each building, including the “heat-generating systems” inside individual schools.
WHYY combed through each school’s facility assessment and found 60 school buildings with heat-generating systems that had an FCI higher than 60 percent.
That is, 60 school buildings in Philadelphia have so many deficiencies that analysts recommend replacing the heating systems.
Before diving any further into this data set we should note that some of these reviews were conducted as far back as May 2015, and some schools may have been updated in the year-and-a-half since.
But this data does provide a snapshot of just how many schools at a given time operate with deficient or compromised heating systems in Philadelphia.
At Solis-Cohen, for instance, the heat-generating system had an FCI of 125.19 percent, meaning it would be cheaper to replace the entire system than to repair its many flaws. Nebinger (101.10 percent) and Cook-Wissahickon (91.93 percent) also had heating systems that needed significant repairs.
Here is the complete list of Philadelphia school buildings with heating systems that should, according to the outside analysts, be replaced.
| SCHOOL | FACILITIES CONDITION INDEX | YEAR INSTALLED | COST TO REPLACE |
| Lincoln (Pool House) | 486.57% | 1955 | 128,200 |
| George Washington HS (Fieldhouse) | 200.03% | 1963 | 122,760 |
| Olney ES | 199.94% | 1900 | 787,837 |
| Gompers | 161.50% | 1950 | 1,045,520 |
| Cramp | 151.03% | 1969 | 1,495,243 |
| Moffet | 140.62% | 1973 | 746,800 |
| Fell | 133.32% | 1981 | 1,138,870 |
| Elkin (Main) | 132.60% | 1973 | 993,244 |
| Cassidy | 130.34% | 1924 | 1,103,826 |
| Bache-Martin | 127.70% | 1906 | 1,079,938 |
| Solis-Cohen | 125.19% | 1948 | 1,698,970 |
| Ethan Allen | 124.47% | 1930 | 1,241,219 |
| Rhawnhurst | 120.97% | 1949 | 858,820 |
| Adaire | 115.95% | 1957 | 931,446 |
| Rowen | 115.62% | 1995 | 1,052,988 |
| Spring Garden | 114.64% | 1967 | 711,220 |
| Catharine (Main) | 109.34% | 1992 | 1,073,525 |
| Hopkinson | 108.10% | 1927 | 1,213,550 |
| Sullivan | 108.10% | 1970 | 1,213,550 |
| Greenberg | 106.94% | 1964 | 1,680,300 |
| Sheppard | 102.26% | 1986 | 634,780 |
| J.H. Brown | 101.87% | 1937 | 1,019,811 |
| Nebinger | 101.10% | 1975 | 1,101,530 |
| Dunbar | 99.24% | 1974 | 879,928 |
| J. Marshall | 98.67% | 1909 | 1,091,262 |
| Carnell | 93.83% | 1970 | 1,398,103 |
| Conwell | 93.12% | 1960 | 1,038,052 |
| Barton | 92.32% | 1972 | 1,347,974 |
| Cook-Wissahickon | 91.93% | 1969 | 1,364,777 |
| Richmond | 91.38% | 1955 | 798,882 |
| Finletter (Main) | 89.62% | 1930 | 1,171,729 |
| Kenderton | 89.36% | 1962 | 1,699,119 |
| Forrest | 87.98% | 1929 | 1,180,878 |
| Comegys | 87.95% | 1966 | 1,318,923 |
| Stanton | 87.81% | 1966 | 746,800 |
| Bodine | 87.75% | 1958 | 1,101,530 |
| Building 21 / The U School | 85.75% | 1970 | 1,864,461 |
| Pennell | 84.61% | 1972 | 1,316,198 |
| Taggart | 82.57% | 1970 | 1,232,220 |
| Ludlow | 82.12% | 1927 | 1,311,194 |
| Disston | 82.02% | 1924 | 1,266,610 |
| Frank | 81.98% | 1962 | 1,390,915 |
| Edmonds | 80.87% | 1988 | 1,502,935 |
| AMY Northwest | 80.09% | 1,929 | 1,297,098 |
| AMY @ Martin | 79.91% | 1950 | 1,162,226 |
| Hamilton | 74.64% | 1970 | 1,670,965 |
| Harrington (Annex) | 72.89% | 1948 | 280,050 |
| Kirkbride | 71.15% | 1926 | 1,064,190 |
| Meade | 70.78% | 1975 | 1,754,980 |
| Taylor (Our Lady of Pompei) | 67.71% | 1963 | 275,140 |
| Morrison | 67.04% | 1924 | 1,566,301 |
| Lowell | 65.72% | 1913 | 1,895,136 |
| Beeber | 65.54% | 1933 | 2,595,130 |
| Wilson | 64.49% | 1928 | 2,604,465 |
| Ellwood | 63.15% | 1957 | 1,038,444 |
| Harrington | 63.14% | 1969 | 1,241,555 |
| Prince Hall | 62.96% | 1971 | 1,474,930 |
| Penrose | 61.58% | 1986 | 797,564 |
| Decatur | 60.75% | 1964 | 1,666,241 |
| Emlen | 60.25% | 1926 | 1,390,915 |
To replace all of these heating systems would cost the district nearly $72 million, according to WHYY’s calculations.
Heat-generating systems have a lifespan of about 35 years, according to the facilities assessment. When the conditions assessment was conducted, Philadelphia had at least 96 buildings with heating systems over 35 years old.
The district’s oldest heat-generating system, at Olney Elementary School in North Philadelphia, was installed in 1900, 12 years before the Titanic sank. The 1906 installation of Bache-Martin’s heat-generating system coincided with the exoneration of French military officer Alfred Dreyfus.
Here are the 25 oldest heat-generating systems in the School District of Philadelphia.
| SCHOOL | FACILITIES CONDITION INDEX | YEAR INSTALLED | COST TO REPLACE |
| Olney ES | 199.94% | 1900 | 787,837 |
| Bache-Martin | 127.70% | 1906 | 1,079,938 |
| J. Marshall | 98.67% | 1909 | 1,091,262 |
| Lowell | 65.72% | 1913 | 1,895,136 |
| Frankford | 40.67% | 1914 | |
| Franklin ES | 32.48% | 1915 | |
| Bregy | 26.62% | 1923 | |
| Cooke | 0% | 1923 | |
| Cassidy | 130.34% | 1924 | 1,103,826 |
| Disston | 82.02% | 1924 | 1,266,610 |
| Morrison | 67.04% | 1924 | 1,566,301 |
| Logan | 40.47% | 1924 | |
| Crossan | 22.54% | 1924 | |
| Wardin | 0% | 1924 | |
| Kirkbride | 71.15% | 1926 | 1,064,190 |
| Emlen | 60.25% | 1926 | 1,390,915 |
| Hopkinson | 108.10% | 1927 | 1,213,550 |
| Ludlow | 82.12% | 1927 | 1,311,194 |
| Wilson | 64.49% | 1928 | 2,604,465 |
| Forrest | 87.98% | 1929 | 1,180,878 |
| AMY Northwest | 80.09% | 1929 | 1,297,098 |
| Comly | 0% | 1929 | |
| Ethan Allen | 124.47% | 1930 | 1,241,219 |
| Finletter (Main) | 89.62% | 1930 | 1,171,729 |
| Beeber | 65.54% | 1933 | 2,595,130 |
Naturally, the age and condition of a heat-generating system is just one factor in building conditions.
But if you are interested in the status of your school, we’ve compiled the age and FCI score for every heat-generating system in the school district. For those systems with an FCI score of 60 percent or greater, we’ve also included the cost of replacing that system.
WHYY is your source for fact-based, in-depth journalism and information. As a nonprofit organization, we rely on financial support from readers like you. Please give today.


