Three revealing charts on state per-pupil funding in Pa. public schools

The searchable graphic allows quick access to information for every Pa. school district. (Azavea)
The searchable graphic allows quick access to information for every Pa. school district.
Recently, we published a story that analyzed the effects of the dramatic enrollment swings that have taken place in Pennsylvania school districts over the past 25 years.
The interactive graphic above was included in that piece, but it’s worth noting as a tool in and of itself.
The graphic is sharable, downloadable and viewable in full-screen mode.
The first tile in the graphic allows users to see the clear correlation between enrollment change and per-pupil state basic education funding. In general, because of the state’s “hold harmless” policy, the more students a district lost, the better its rank in per-pupil state funding.
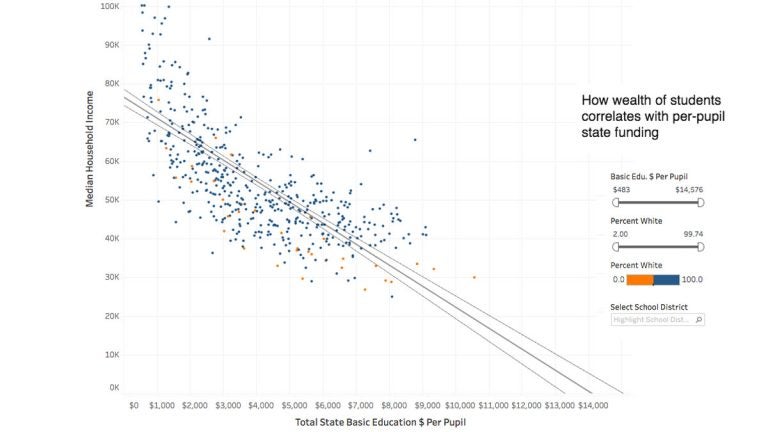
Using the sliders on the right you can see how correlations change based on race and level of funding.
The second tile compares median household income with state funding allocations. In general, poorer districts receive more state funding, but the graphic highlights some important disparities.
For instance, it shows that many districts serving a majority of students of color receive less per-pupil state support compared with many predominantly white districts of equal or higher wealth.
To give one example: Erie SD, with a median household income of about $33,000, gets less state support than Wattsburg SD, Riverside Beaver County SD, and Avella SD — each with median incomes over $60,000.
Other analyses have also highlighted this racial disparity.
The third tile looks specifically at the districts getting the most per pupil from the state.
This analysis studies the basic education subsidy, which is the state’s largest budget line for public schools. Districts also receive monies from other state budget lines as well as from local and federal sources.
In another recent post, we published an interactive map that illustrates how state funding would change if lawmakers chose to implement the state’s new student-weighted funding formula more rapidly.
That new formula prioritizes a number of factors that don’t currently come into account when lawmakers dole out the bulk of state funding for schools.
Those factors include enrollment, poverty levels and language fluency.
WHYY is your source for fact-based, in-depth journalism and information. As a nonprofit organization, we rely on financial support from readers like you. Please give today.


