N.J. is sharing more data on COVID activity in schools. Here’s what it shows
In addition to data on the number of COVID-19 cases in N.J. schools, it includes information on staff vaccination rates and the number of students learning remotely.
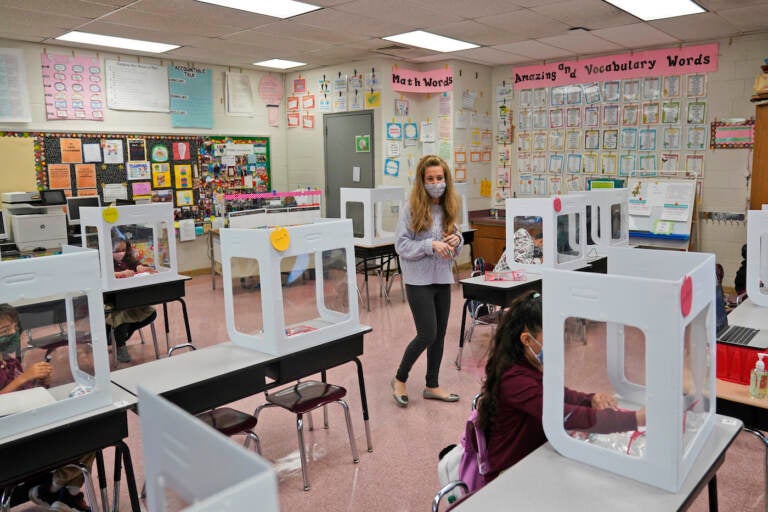
File photo: Maria Mirkovic works with some of her third graders in her classroom at Christa McAuliffe School in Jersey City, N.J., Thursday, April 29, 2021. (AP Photo/Seth Wenig)
Ask us about COVID-19: What questions do you have about the coronavirus and vaccines?
COVID-19 cases in both K-12 and higher education institutions in New Jersey have been trending upward since the second week of November, according to state data.
According to the state’s COVID-19 dashboard, the rise began after declines from case peaks from early in the academic year. Cases at colleges in universities peaked in mid-September. For K-12 schools, cases peaked in October.
“There was a fairly dramatic increase in the number of cases,” said Dr. Stephanie Silvera, an epidemiologist and public health professor at Montclair State University, when discussing case trends, particularly in K-12 schools.
“We’re a little over two weeks now out from Halloween, which we know those holidays also bring an increase in case rates,” she added, “and we’re seeing the same trends there.”
Officials in New Jersey and across the country are concerned about case rates going up as people travel for the holidays. They have been encouraging people to get their vaccine booster shots, or get vaccinated, to reduce their risk of getting infected.
The information about rising cases in schools and colleges comes as the state begins to share more data on how schools and higher education institutions are being affected by the pandemic.
The state Health Department began posting data Monday to the COVID-19 dashboard, showing a weekly snapshot of COVID activity based on reports from staff, parents, and test results from schools.
The new data provides new and cumulative case rates among students and staff. It also shows trends over time and current activity by county. For K-12 schools, data includes staff vaccination rates and the number of students learning remotely because of COVID-19 quarantine policies.
On the college and university level, data on the number of students in isolation or quarantine, vaccination rates and the number of COVID clusters on campus is shared. A COVID cluster on a college campus is defined as two or more people linked to a common activity associated with the school community.
“This new information can help school administrators, teachers, students, and parents track case rates over time, see how their county is faring compared to surrounding areas, monitor the number of students learning remotely in K-12 due to COVID-19, and track the number of college and university students in isolation or quarantine at both the county and the regional level,” said Judy Persichilli, New Jersey’s health commissioner.
However, while more information about pandemic trends are now being shared on the state’s dashboard, it does not include every school or college.
The most recent data currently displayed, for the week ending Nov. 14, is from nearly 60% of the state’s school districts and more than 40% of higher education intuitions.
“We are enrolling more schools each week,” Persihilli said at Monday’s COVID-19 briefing. “However, at this time, reporting is not yet 100%.”
Silvera said the state wants “as close to 100%” in terms of data collection and reporting to know if health measures are effective. One place where collecting all of the data can be helpful is when monitoring K-12 schools.
“We’re talking about populations that are either only just recently eligible for vaccination or not yet eligible to be vaccinated,” she said. “Understanding those case rates so that decisions that are going to be upcoming about mask wearing, for example, can be made in an environment of really understanding deeply what the situation truly is.”
However, the data that is available now helps when it comes to making public health decisions.
“I think it guides us in a direction of what’s been going on and what we can expect to continue,” Silvera added.
WHYY is your source for fact-based, in-depth journalism and information. As a nonprofit organization, we rely on financial support from readers like you. Please give today.
