Mapping 10 years of Philadelphia block parties
Philadelphia is a block party city. Take a stroll around any Philly neighborhood on a weekend afternoon in the summer, and you’ll probably spot more than one. The city offers residents a very lightweight process for closing their streets for a weekend day of community fun: Pay an affordable $25 permit fee, and get the approval of 75% of the neighbors.
And close streets we do! The permissive approach toward random street closures has allowed a true culture to form around the practice. Articles referencing Philly block parties always mention that residents close more streets for neighborly gatherings than any other large U.S. city.
Everyone knows that this block party culture exists, but to date, there hasn’t been very good information available for measuring the shape of this phenomenon. Which city regions are the biggest block party fanatics? Which special occasions are people most likely to organize parties for? Are people partying more or less today than they were 10 years ago?
Now, thanks to a new city dataset obtained by PlanPhilly, and mapped by GIS analyst Shrobona Karkun, the last ten years of block party data are available for our perusal.
2006-2016: Block Parties by the Block
Block Partiest Blocks
- 3500 Ryan Ave. (69)
- 3400 N. Water St. (56)
- 500 W. Huntingdon St. (55)
- 2000 N. Lawrence St. (53)
-
2700 S. Fairhill St. (51)
2700 N. 8th St .(51) -
3000 N. Bailey St. (49)
1400 N. Hobart St. (49) - 500 W. Willow Grove Ave. (48)
- 1000 Greenwich St. (46)
-
3000 N. 9th St. (45)
2500 N. Bancroft St. (45)
2200 N. Howard St. (45)
2000 Ellsworth St. (45)
100 E. Ontario St. (45) - 600 W. Venango St. (44)
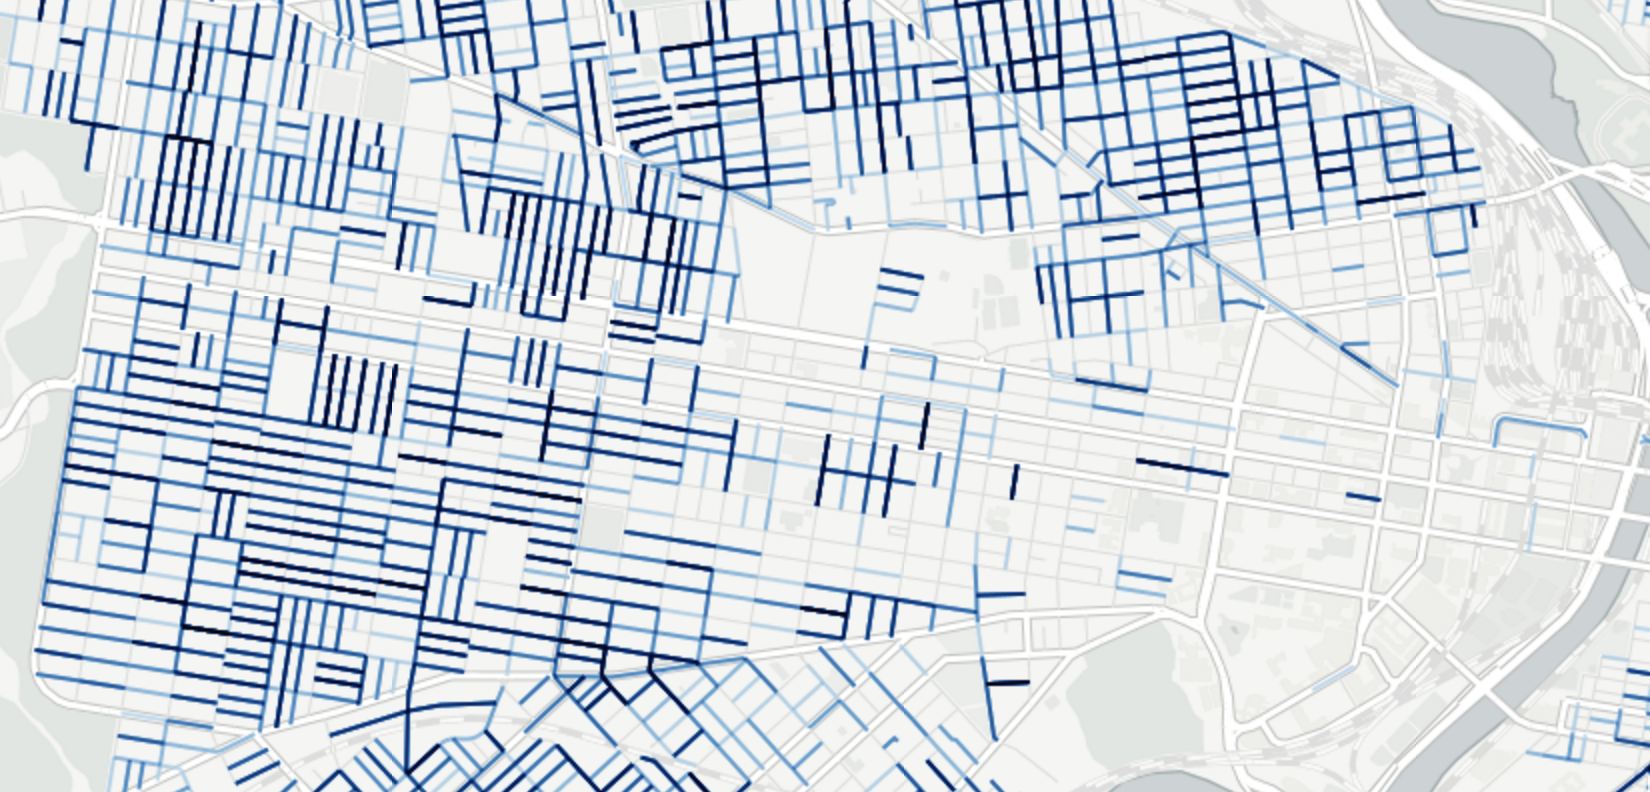
This map shows every block party hosted in the city of Philadelphia between 2006 and June 2016. Over these ten years, residents have gotten permits for a total of 68,553 block parties, in almost every corner of the city.
Zoom in, and you’ll see something remarkable. At some point over the past ten years, nearly every block has hosted a block party at one point. Sections of the Northeast and Northwest are the big exceptions, perhaps because residential development patterns are less dense, and yards and other off-street open spaces are more available for neighborhood gatherings.
The darker a block is shaded, the more block parties it has hosted. While there are party clusters in all regions of the city, North Philly and West Philly are the runaway winners.
2006-2016: Which zip codes have the most block parties?
North Philly and West Philly are far and away the block party champions, though the Port Richmond area is an important outlier.
The West Philly and North Philly zipcodes were in a class of their own, averaging somewhere between 5,250 and 5,500 block parties over 10 years, while South Philly zipcodes averaged closer to 3,500. The variation within regions is also interesting. Within the Riverwards, for examples, Port Richmond residents hosted around 6,258 block parties, while Fishtown held just 2,517. The zipcode covering Northern Liberties, Olde Kensington, and Poplar had fewer still, with just 1,089 parties.
The area around Center City featured just 2,383 block parties between Lombard and Vine Street, river to river. By contrast, Southwest Center City, including Fitler Square, Graduate Hospital, Point Breeze, and Grays Ferry, held 4,432 block parties over the same period.
Top 5 Block Partying Zipcodes
- 19143 with 7109 parties (West Philly, Garden Court, Squirrel Hill, Kingsessing, Cobbs Creek)
- 19140 with 7014 parties. (North Philly, Hunting Park, Tioga, Nicetown, Franklinville)
- 19132 with 6348 parties. (North Philly, Strawberry Mansion, Glenwood)
- 19134 with 6258 parties. (Kensington, Port Richmond, Harrowgate)
- 19121 with 6218 parties. (North Philly, Temple, Girard College, Brewerytown)
2006-2016: Block Parties by Year
Block party totals have varied a lot from year to year, peaking in 2008 with 7,678 permits, and hitting a relative low in 2015, the last complete year, at 5818. This year, 704 permits were filed through the end of June.
The bad news for block party fans is that there’s been a downward trend in the number of permits being filed each year. The good news is that, in absolute terms this is still a ton of block parties. And the city recently made it easier than ever for people to organize them with an online application.
Another factor to consider is that this data set only includes authorized block party permits that people paid for. It doesn’t include all the block parties out there held without a permit from Streets, so keep in mind that this is only a partial picture of the phenomenon.
10 Years of Block Parties in 90 Seconds
This animation created by Shrobona Karkun shows the relationship between block party locations, the month of the year, and event types (more on this in a minute.)
Not surprisingly, more parties are scheduled during in the warmer months, and they peak between July and September. But there are still plenty of occasions like birthdays, and holidays like Halloween that keep the party permits going all year round. Every month, there are at least a few happening somewhere.
2006-2016: Types of Block Parties
For the vast majority of permits, people don’t specify what kinds of parties they’re having. But some people fill out this part of the permit form, and 5,758 of the 68,553 block party permits contained some form of description–about 8% of the sample.
It wouldn’t be scientifically accurate to extrapolate from this sample that the rest of the parties follow a similar breakdown, but just for fun, here are the most popular party types in the database, excluding general parties.
July 4th and Labor Day are far and away the major block party occasions, followed distantly by Memorial Day, serenades, and Halloween.
What is a Serenade?
Serenades are a South Philly Italian-American wedding tradition where the groom sings his betrothed a love song in front of family and friends prior to the wedding.
The concept originated in Italy as a more personal serenade by the groom for his future wife, and maybe her parents, the night before the wedding but Italian-Americans in South Philadelphia have adapted it over time to the point where it’s basically just a big block party. It usually happens about a week before a wedding now. The part of the tradition that endures is that the groom still sings a love song of his choosing to the bride. (Here is one example of a serenade.)
As the map shows, serenades are almost exclusively a South Philly thing, although if you zoom out, you’ll also see a few instances of North Philly serenades. There were 247 block party permits for serenades between 2006 and 2016.
2006-2016: Summer Holidays
Another way of looking at where block parties are concentrated is to focus only on the popular summer holidays, which see an outsized number of permit filings. This helps cut out some of the noise from all the general permits, and shows what the geographic pattern looks like on the most regular and reliable block party days.
Here we see even fewer Center City, University City, and even northern South Philly parties, while western West Philly, all of North Philly, and Point Breeze stand out for their holiday revelry.
The incredible number of block parties in Philadelphia says something important about our built environment, and the social life it promotes. And it also says something about its people. It jibes with Philly’s flair for the informal. It demonstrates a basic appreciation that our streets can be public spaces for people. And it reveals a wealth of community-minded people and organizers living in every Philly neighborhood, such that on each of these blocks, at least one person cared enough to collect all the signatures, pay a small fee, and plan a good time for their neighbors.
WHYY is your source for fact-based, in-depth journalism and information. As a nonprofit organization, we rely on financial support from readers like you. Please give today.
