


Infographics: Who drives in Philadelphia, and who doesn’t?

Making continuous progress on the Nutter administration’s goal of reducing driving in Philadelphia is going to be tricky for the next mayor and council members, not only because improving the relative convenience of the non-car travel options is often legitimately and technically hard, but also because there are all types of class and identity politics that come to bear on people’s transportation choices.
As we’ve seen in several different examples over the past year, choices about the allocation of right-of-way on the streets are substantially political choices, and since 2012, they’re political choices that are increasingly up to City Council.
City Councilmembers tend to be more acutely sensitive to public opinion than the technocrats in the Mayor’s office are thought to be, and oftentimes what guides public opinion about who “deserves” the public right-of-way on the street isn’t always clear thinking about what street design configurations might work best to move the most people around. Rather its the perception of how people like them get around.
That’s why facts about mode share are so politically salient–they immediately bring to the fore the question of what share of public resources (including public street space) the different transportation options deserve.
So what do we know about mode share in Philadelphia?
- Citywide, about half of the people get to work by driving alone.
- About a quarter get to work taking public transit, and of those transit users, almost three-quarters take the bus.
- About 9% carpool, 8% walk, 2% bike, and the rest either work at home or get around some other way.
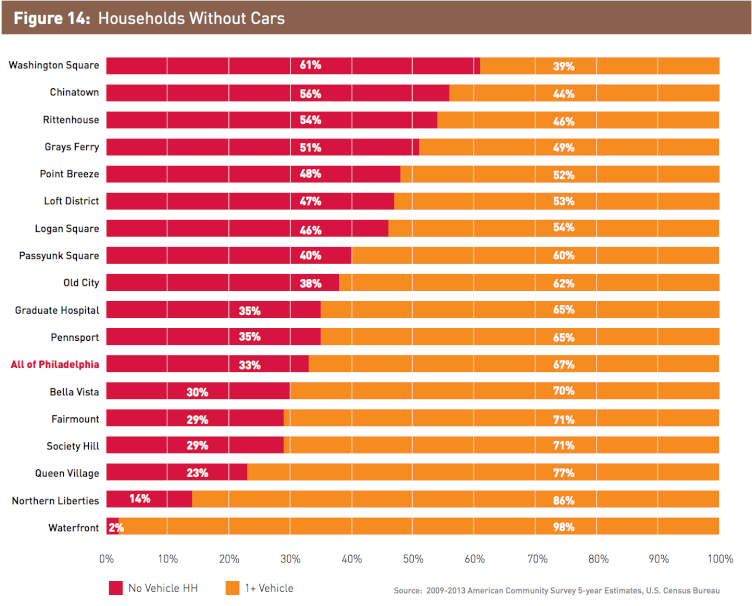
We also know from the most recent Center City District report that people who live in the denser, more urban areas of the city drive less than people in the extended greater Center City neighborhoods, and that people who live in the extended Center City area drive less than people who live further away from the core.
“In the Core, 39% of commuters walk to work, while fully 71% are able to commute to work without a car,” they wrote, while “in the extended neighborhoods, 56% commute without a car, compared to the balance of the city where more than 60% rely on automobiles to get to work.”
Here is their helpful chart of which neighborhoods have the lowest rate of car commuting:
Most of the discussion about this issue has relied on inferences about Philly extrapolated from the national numbers, or generalizations based on what we know about who lives in different neighborhoods and the commuting patterns there. That’s all pretty inexact though.
So to help PlanPhilly move this conversation forward, Rinoa Guo and Ethan Connor-Ross of Econsult prepared some original data visualizations using PUMS data (Public Use Microdata Sample) from the American Community Survey that should bring us closer to answering the big questions everyone is really interested in: what is the demographic profile of drivers and non-drivers in Philadelphia, and what is the distributional impact of policies that make car ownership more or less expensive?
Each graphic compares the citywide numbers (in green on the left) to the numbers for greater Center City (in blue on the right), which reveals some interesting differences between the denser, more urban areas of Philadelphia and the less dense parts.
Here’s what they found:
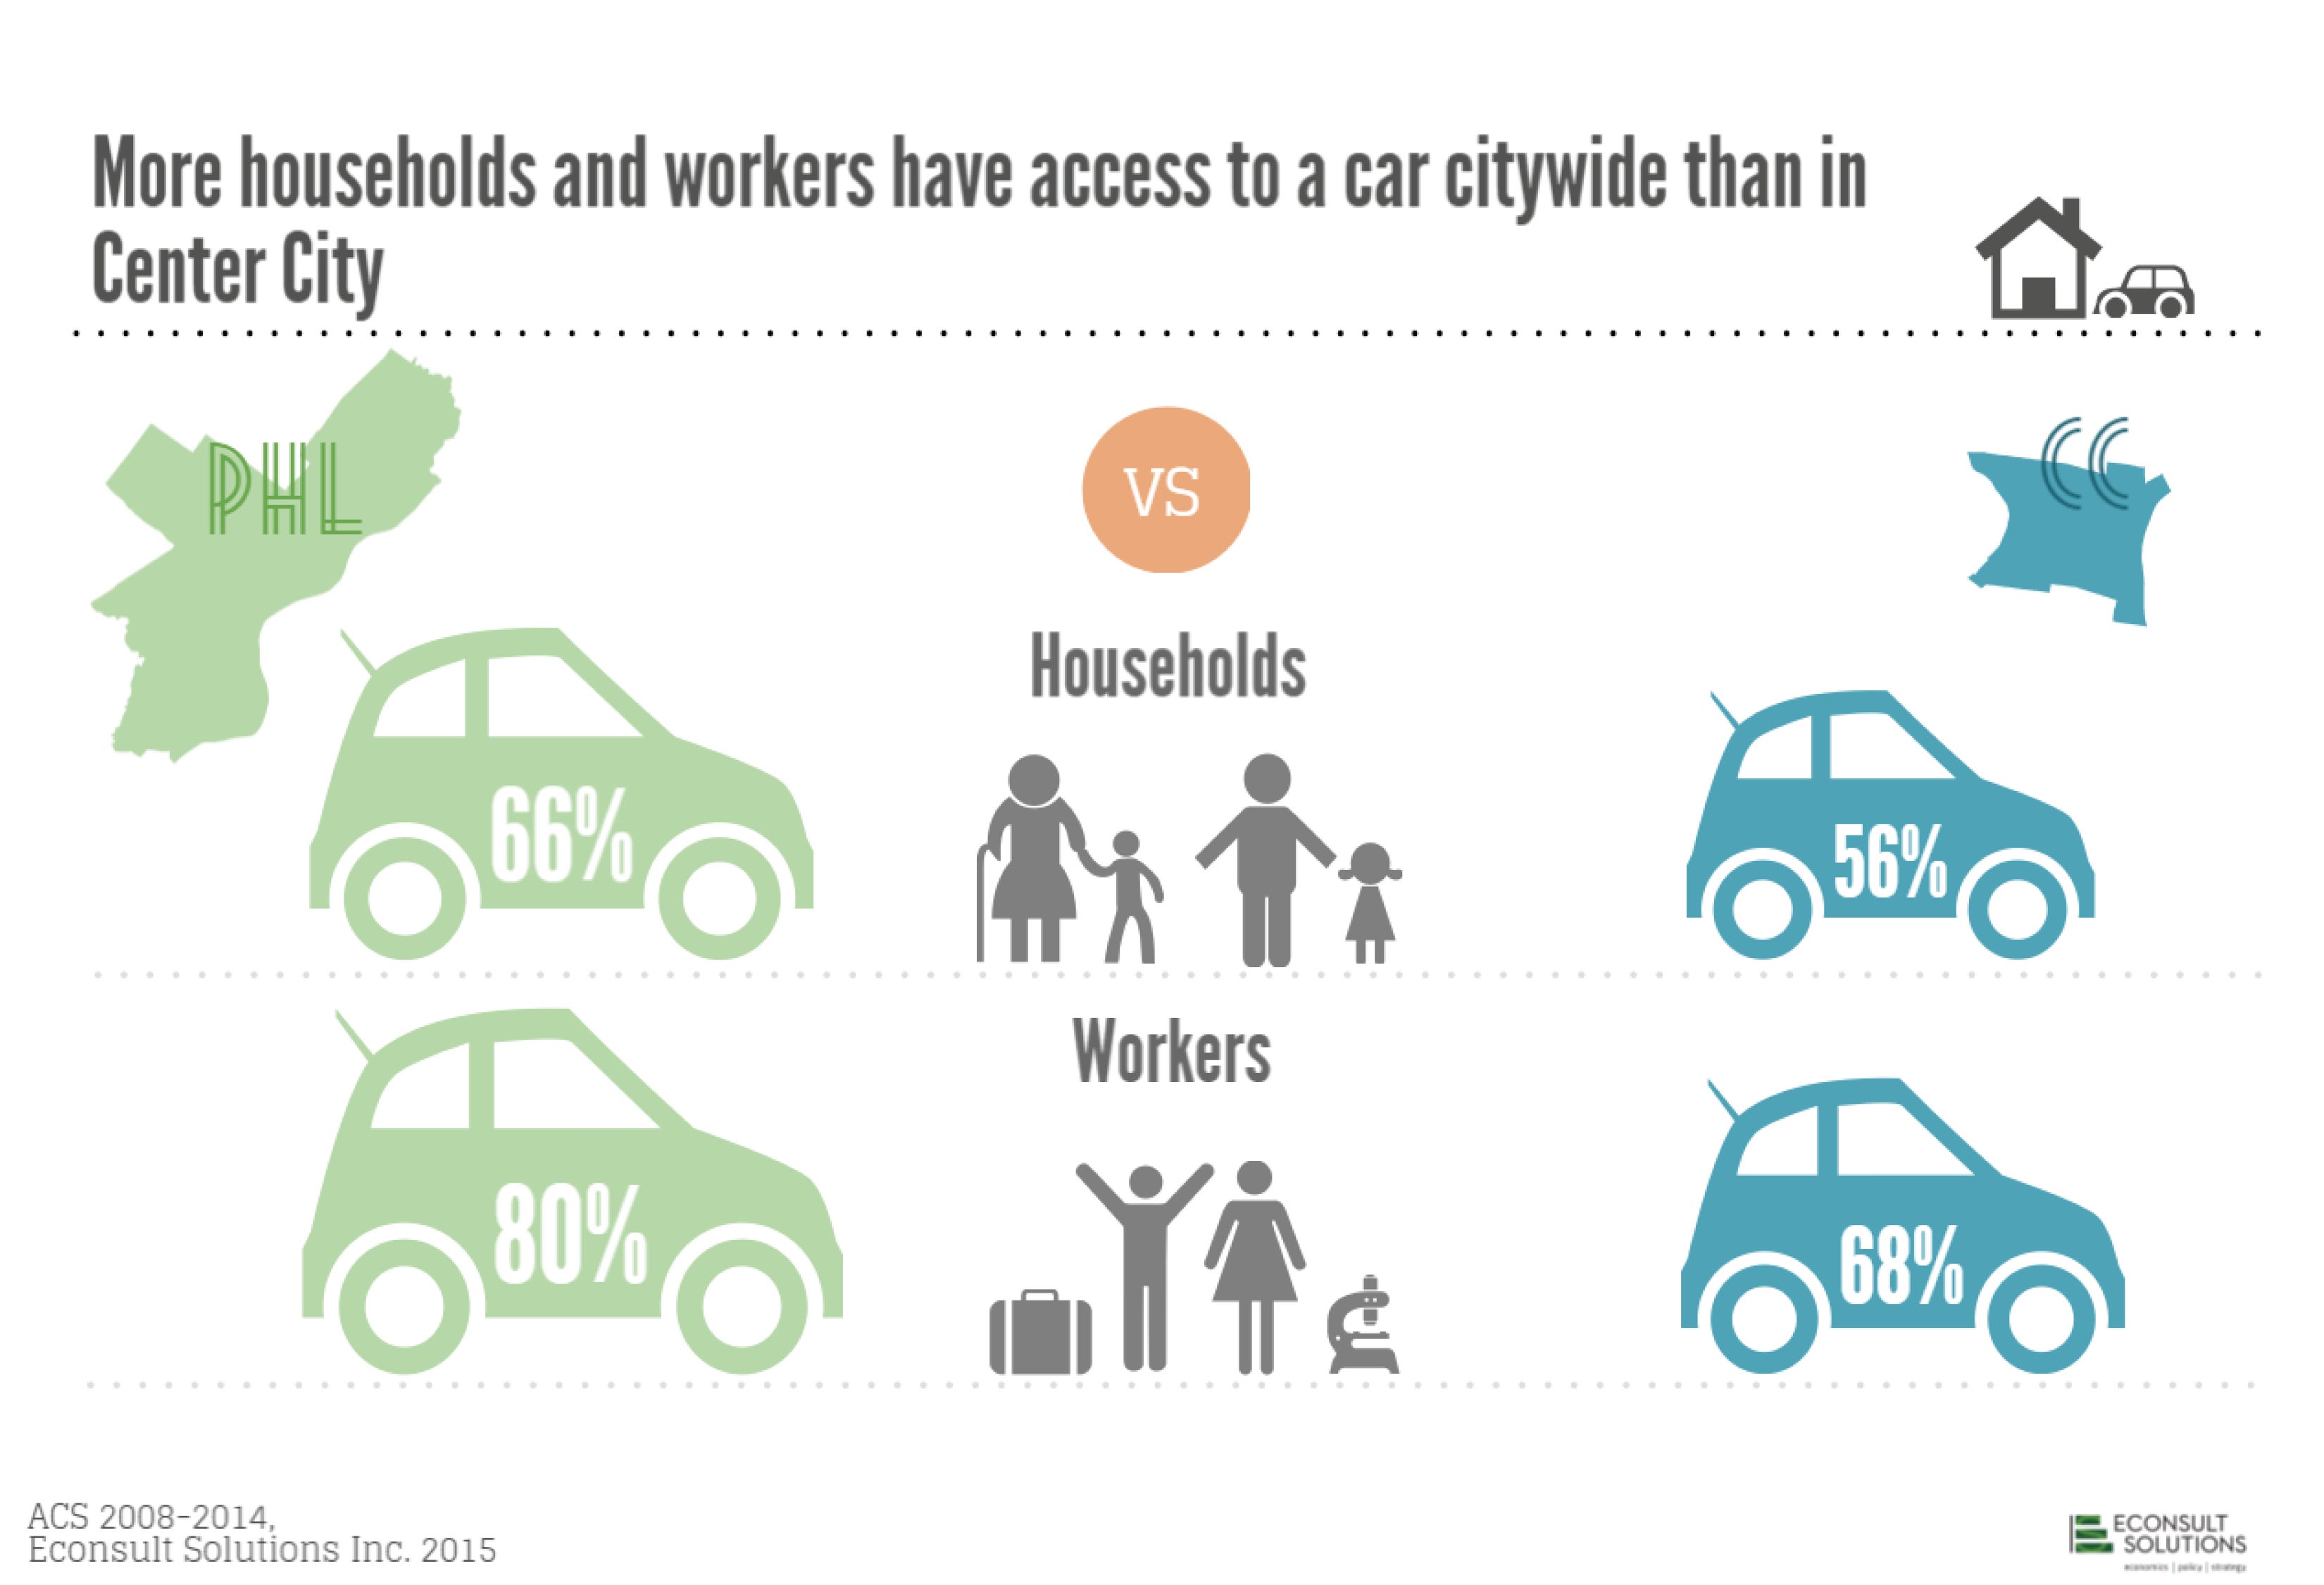
Car ownership is less common in the areas where it’s easiest to get around without a car. Center City has more mixed-use neighborhoods where a variety of stores and neighborhood services are located within a short walking or biking distance from houses, and there are more frequent transit options to choose from for longer trips.
Geometry and cost are also important factors: there just isn’t enough space in Center City to accommodate one car for each person or household, and the higher land costs in the core militate in favor of expensive underground parking which is unaffordable for many people.
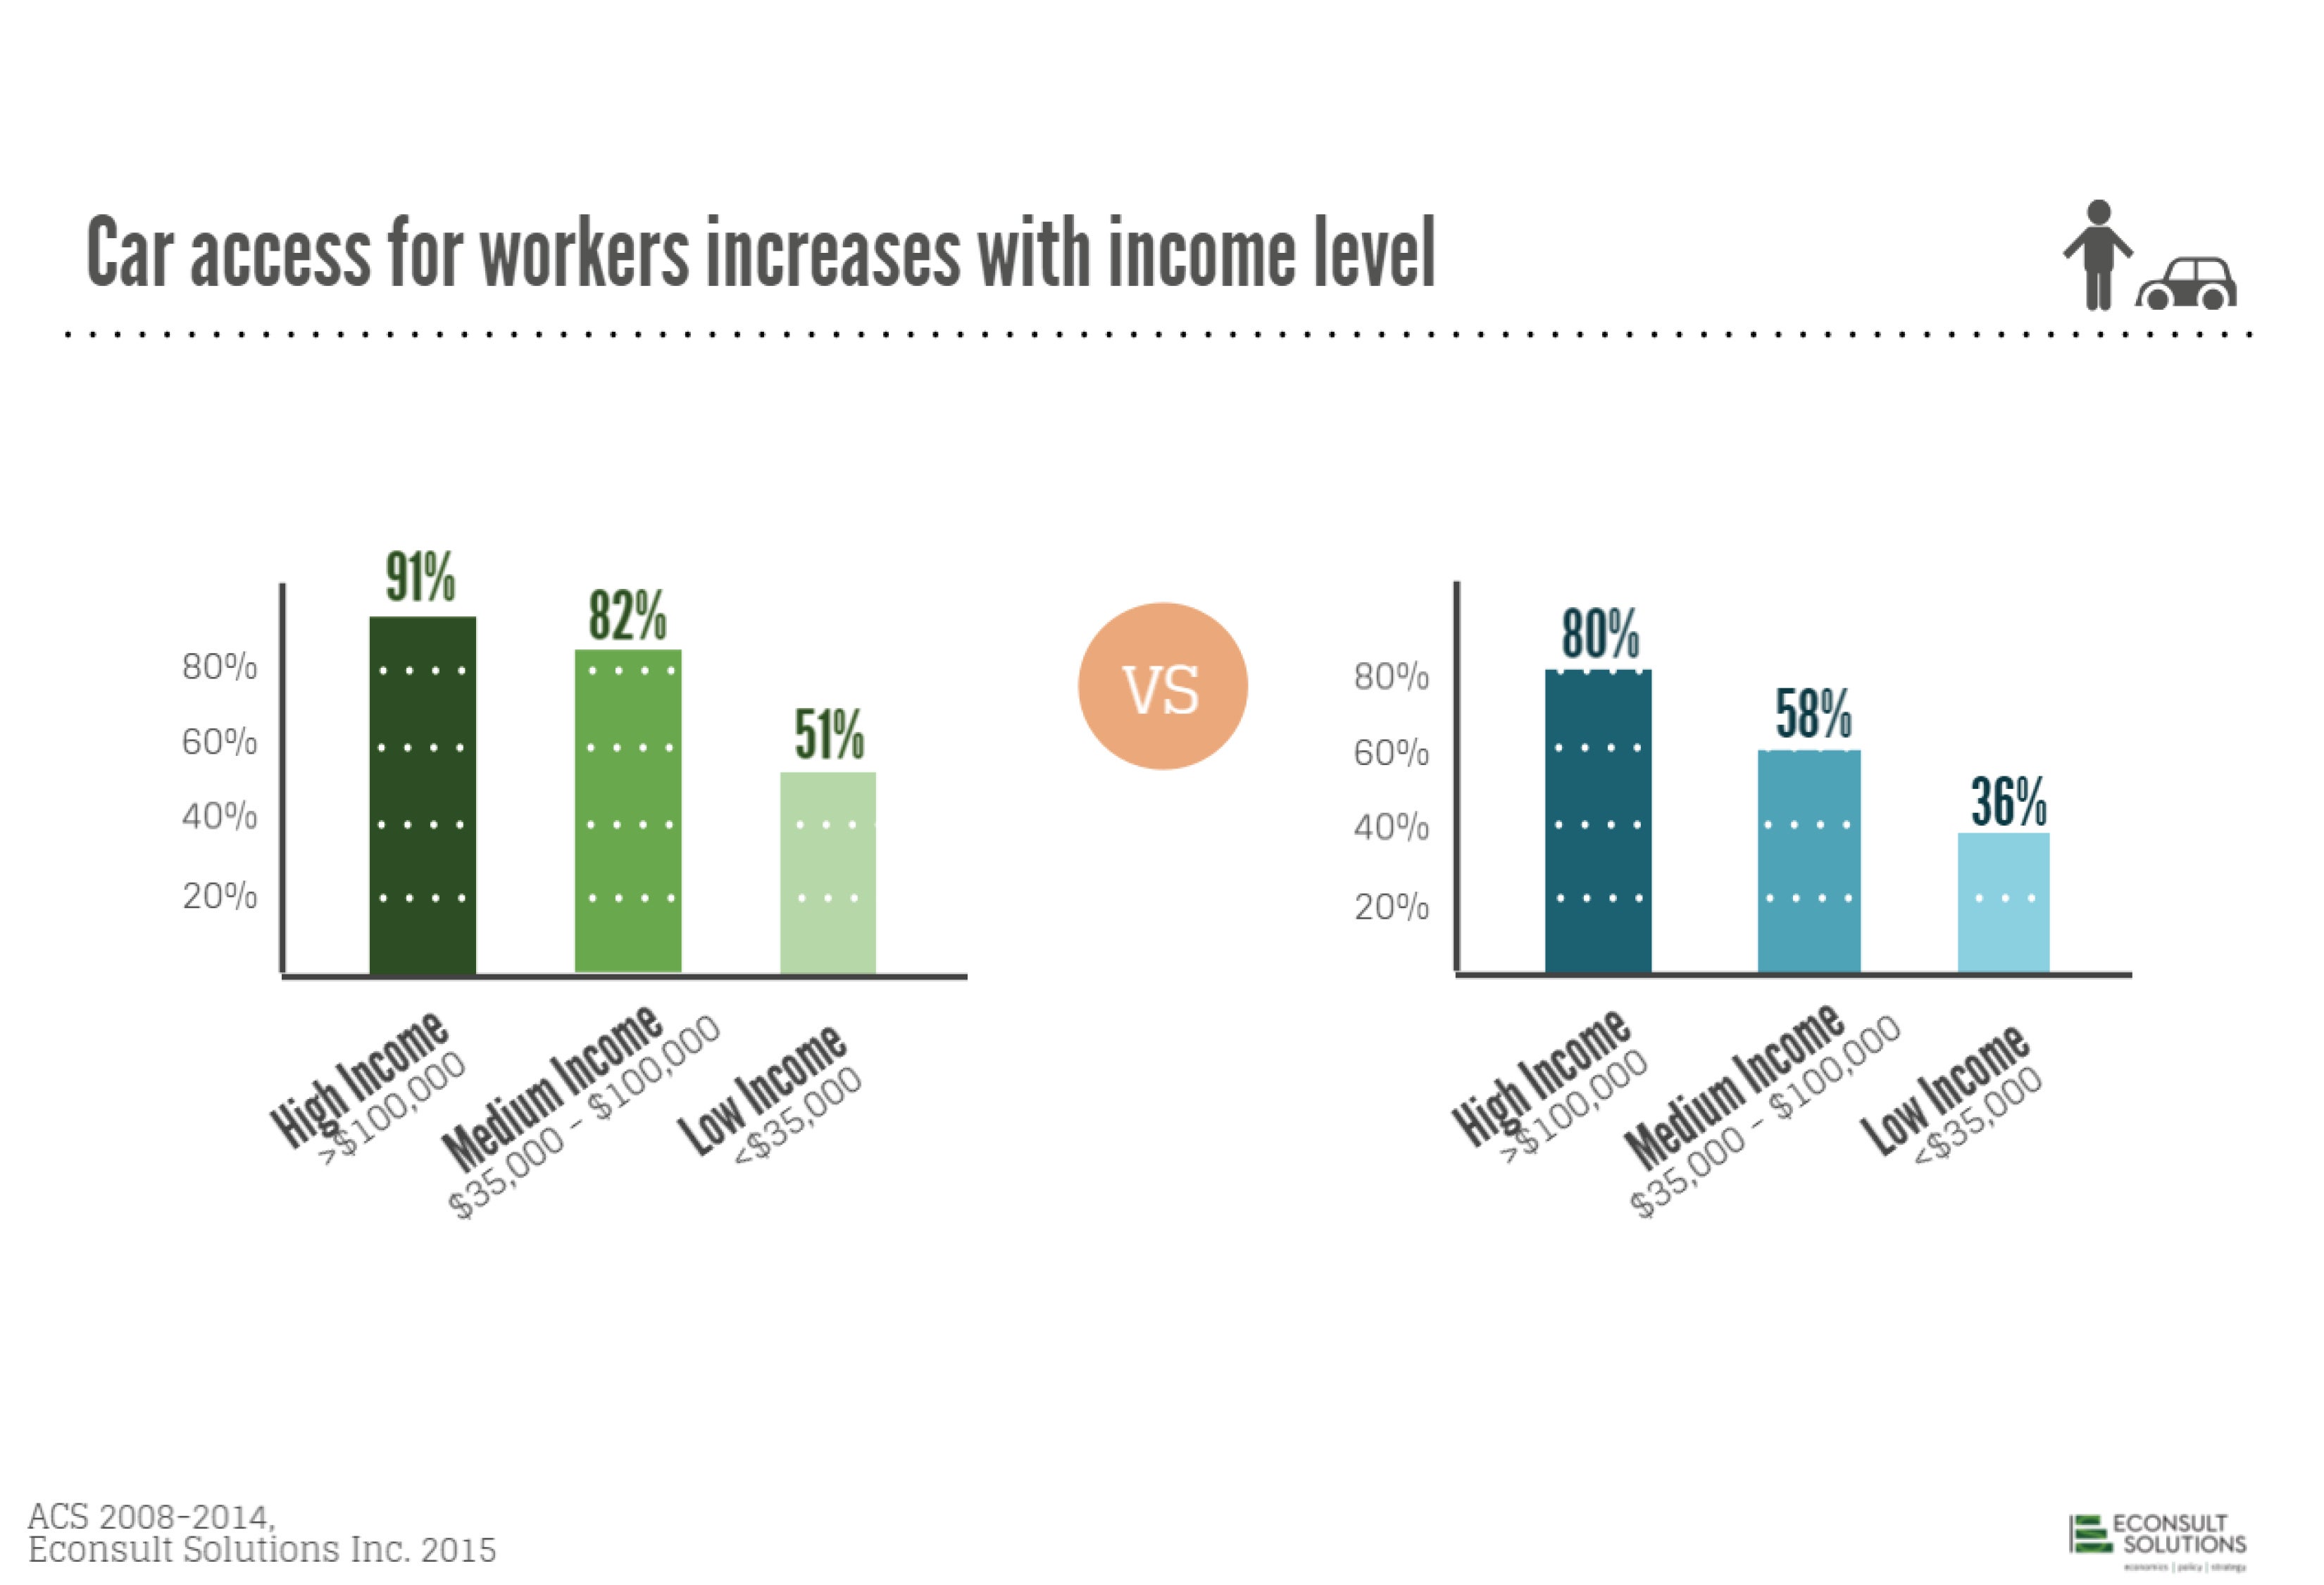
Car access correlates with income, but car access is lower across the board in Center City, especially on the lower end of the income scale. Higher income people are much more likely to be car owners citywide.
This is pretty intuitive, given that cars are expensive, but there’s a lot of pro-car populism out there that borrows the rhetoric of equity for causes like free or cheap parking. The actual data suggests policies that chiefly benefit motorists are regressive.
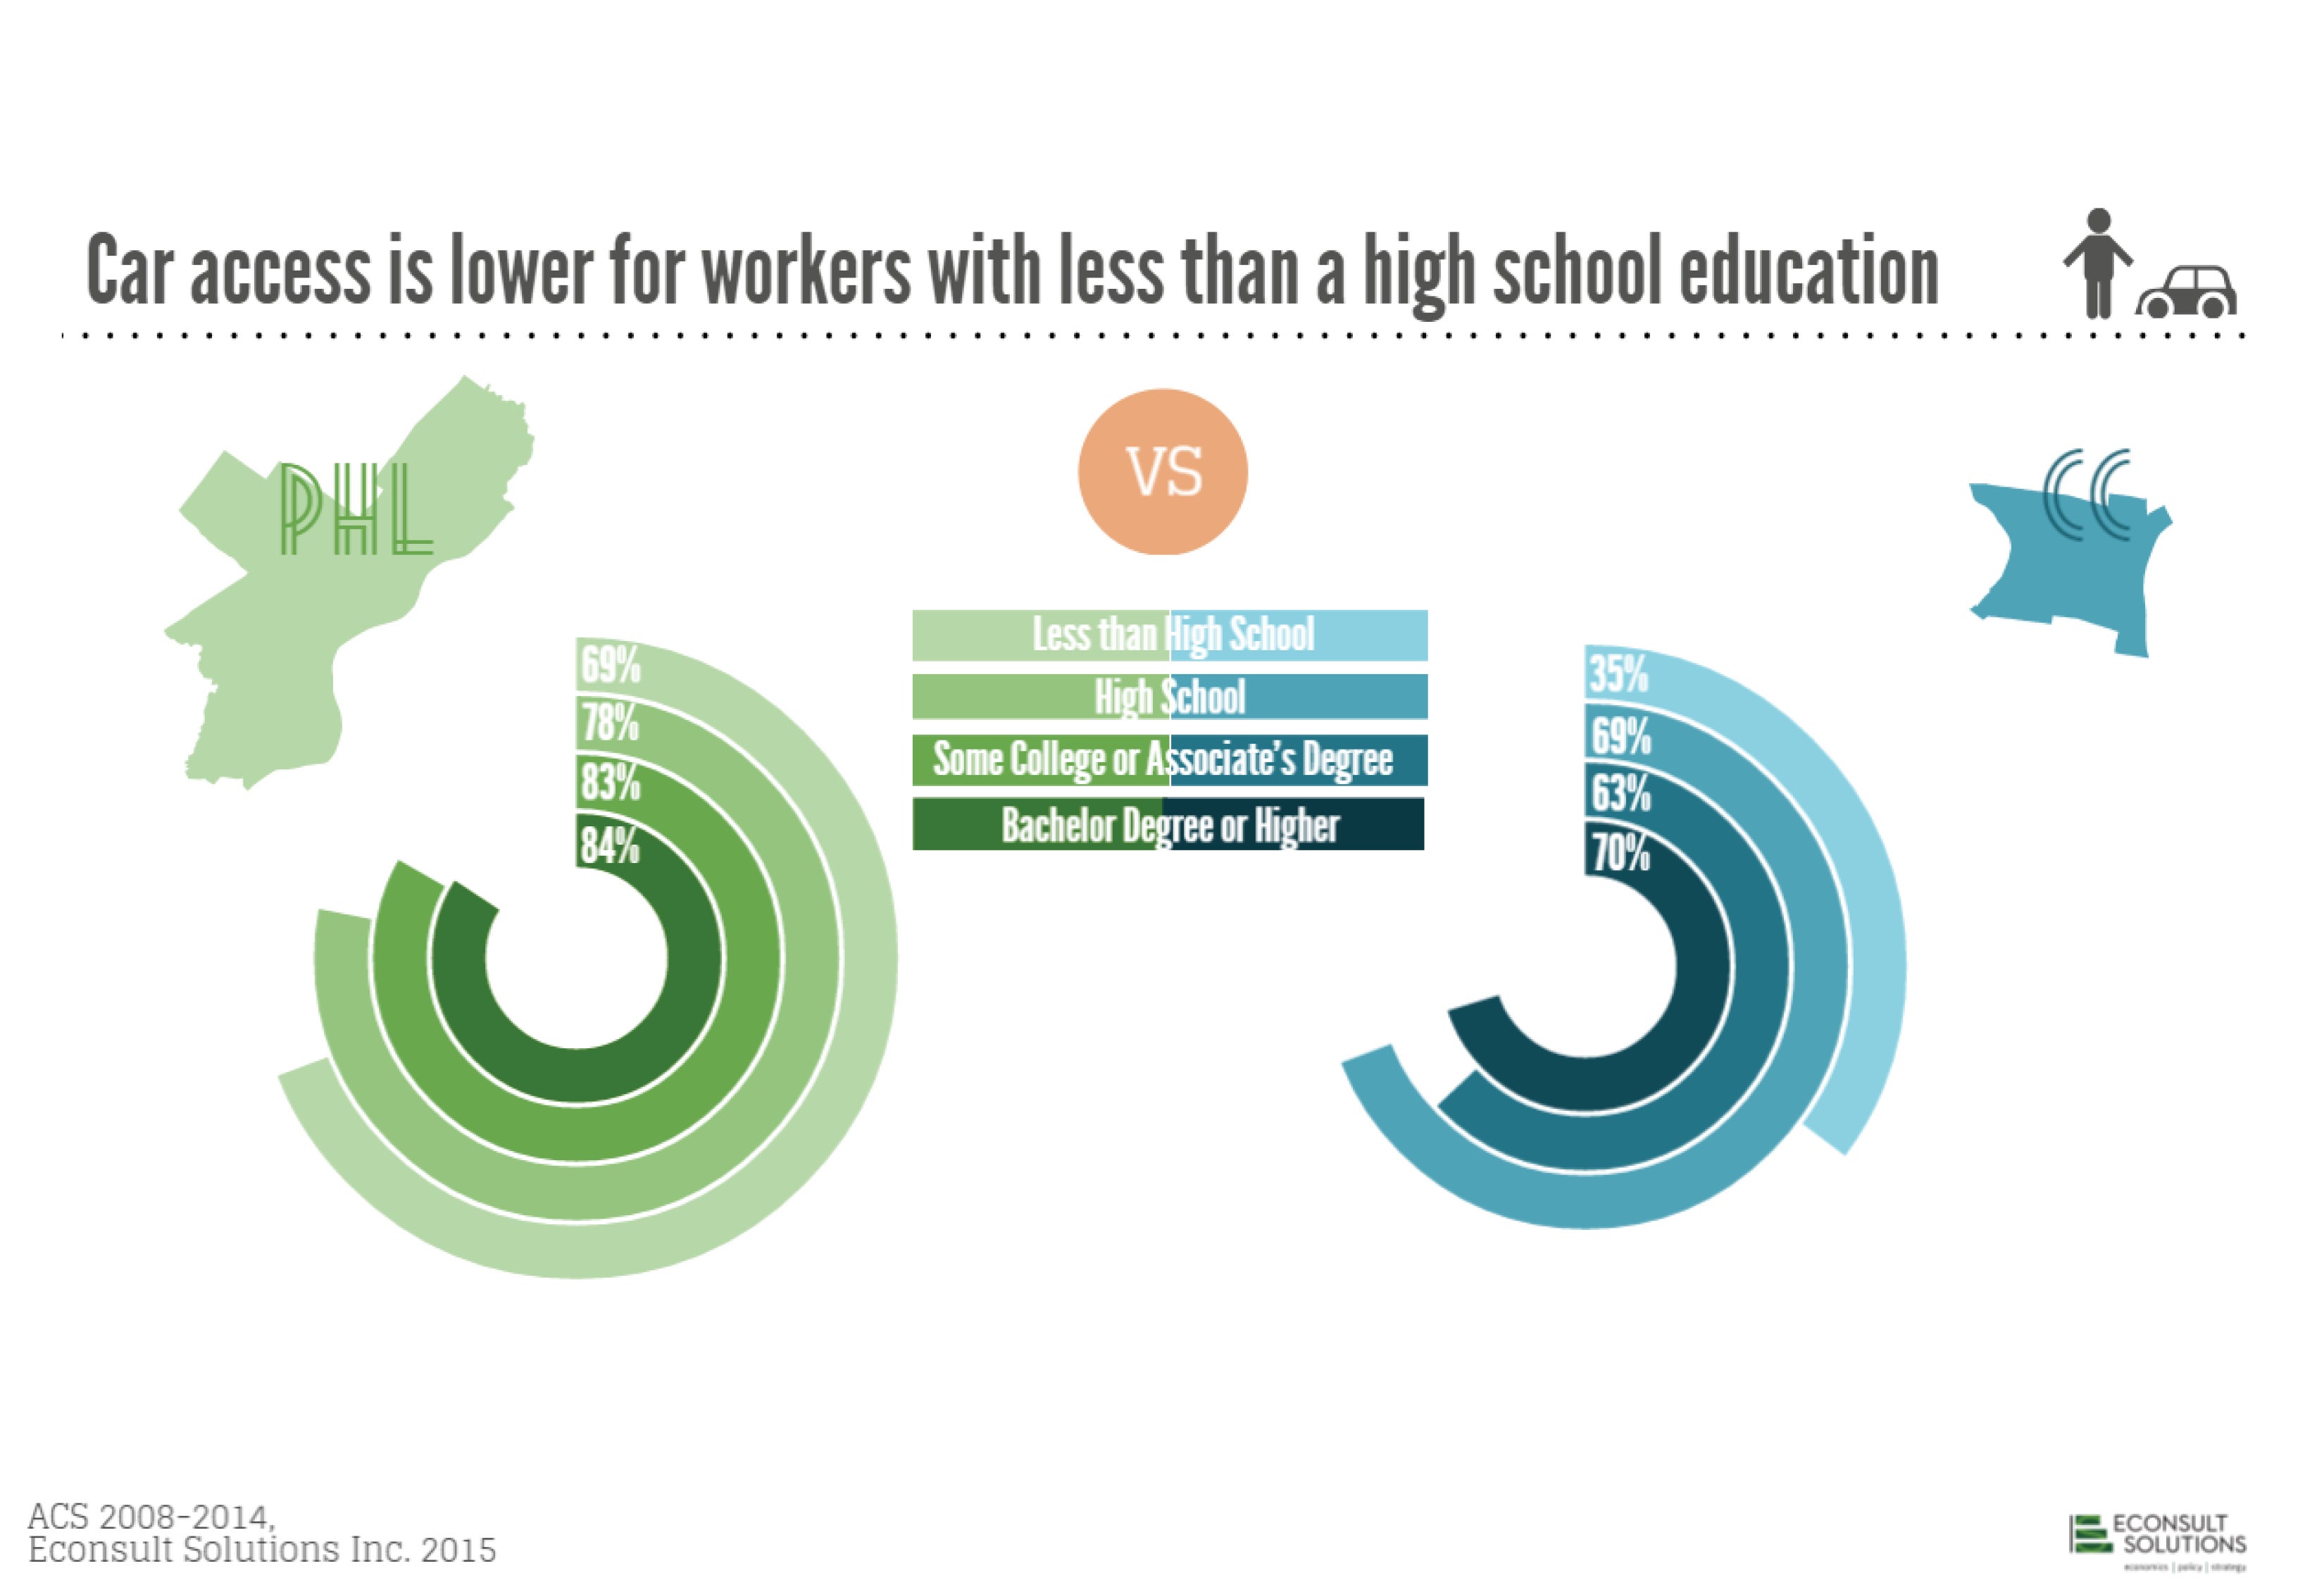
This isn’t too surprising either, since education tends to correlate with income. Notice the big jump in car access in Center City between high school graduates and non-graduates. And once again we see Center City with lower rates of car access across the board.
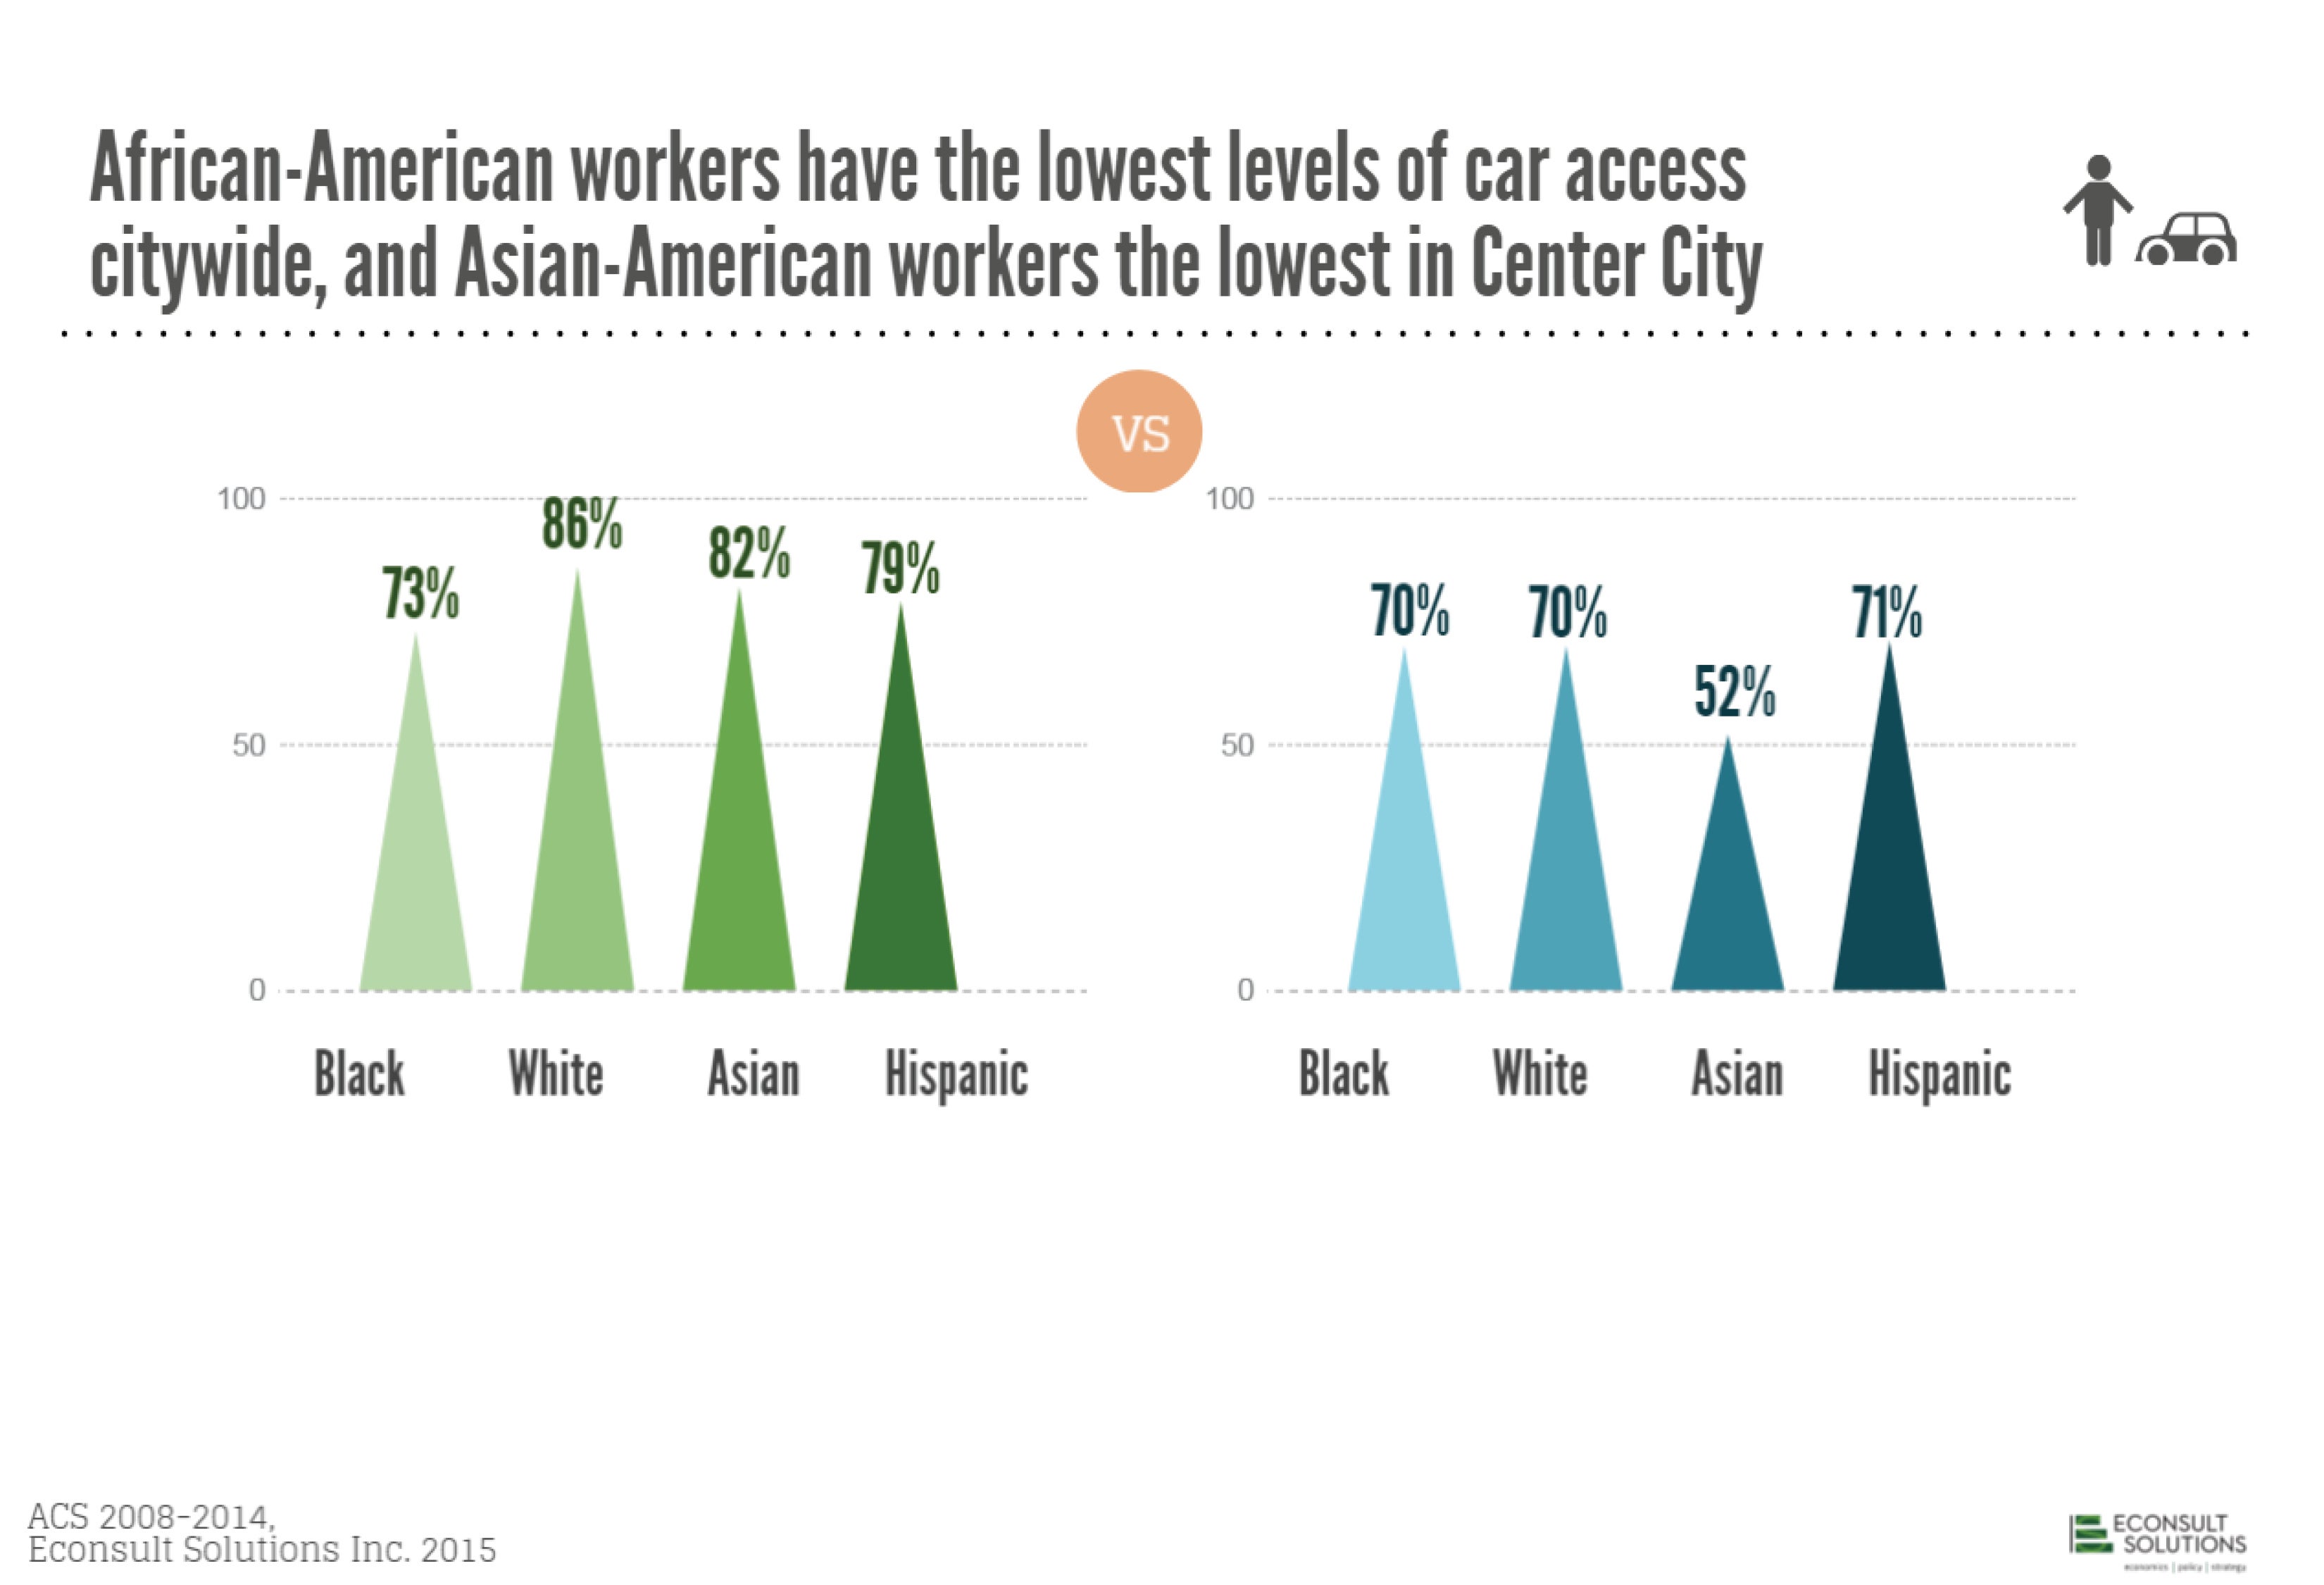
In Center City, Asian-Americans are really driving the trend toward lower car use. This is signficant for land use and development policy in areas like south and northeast Philly that are experiencing higher levels of Asian-American immigration.
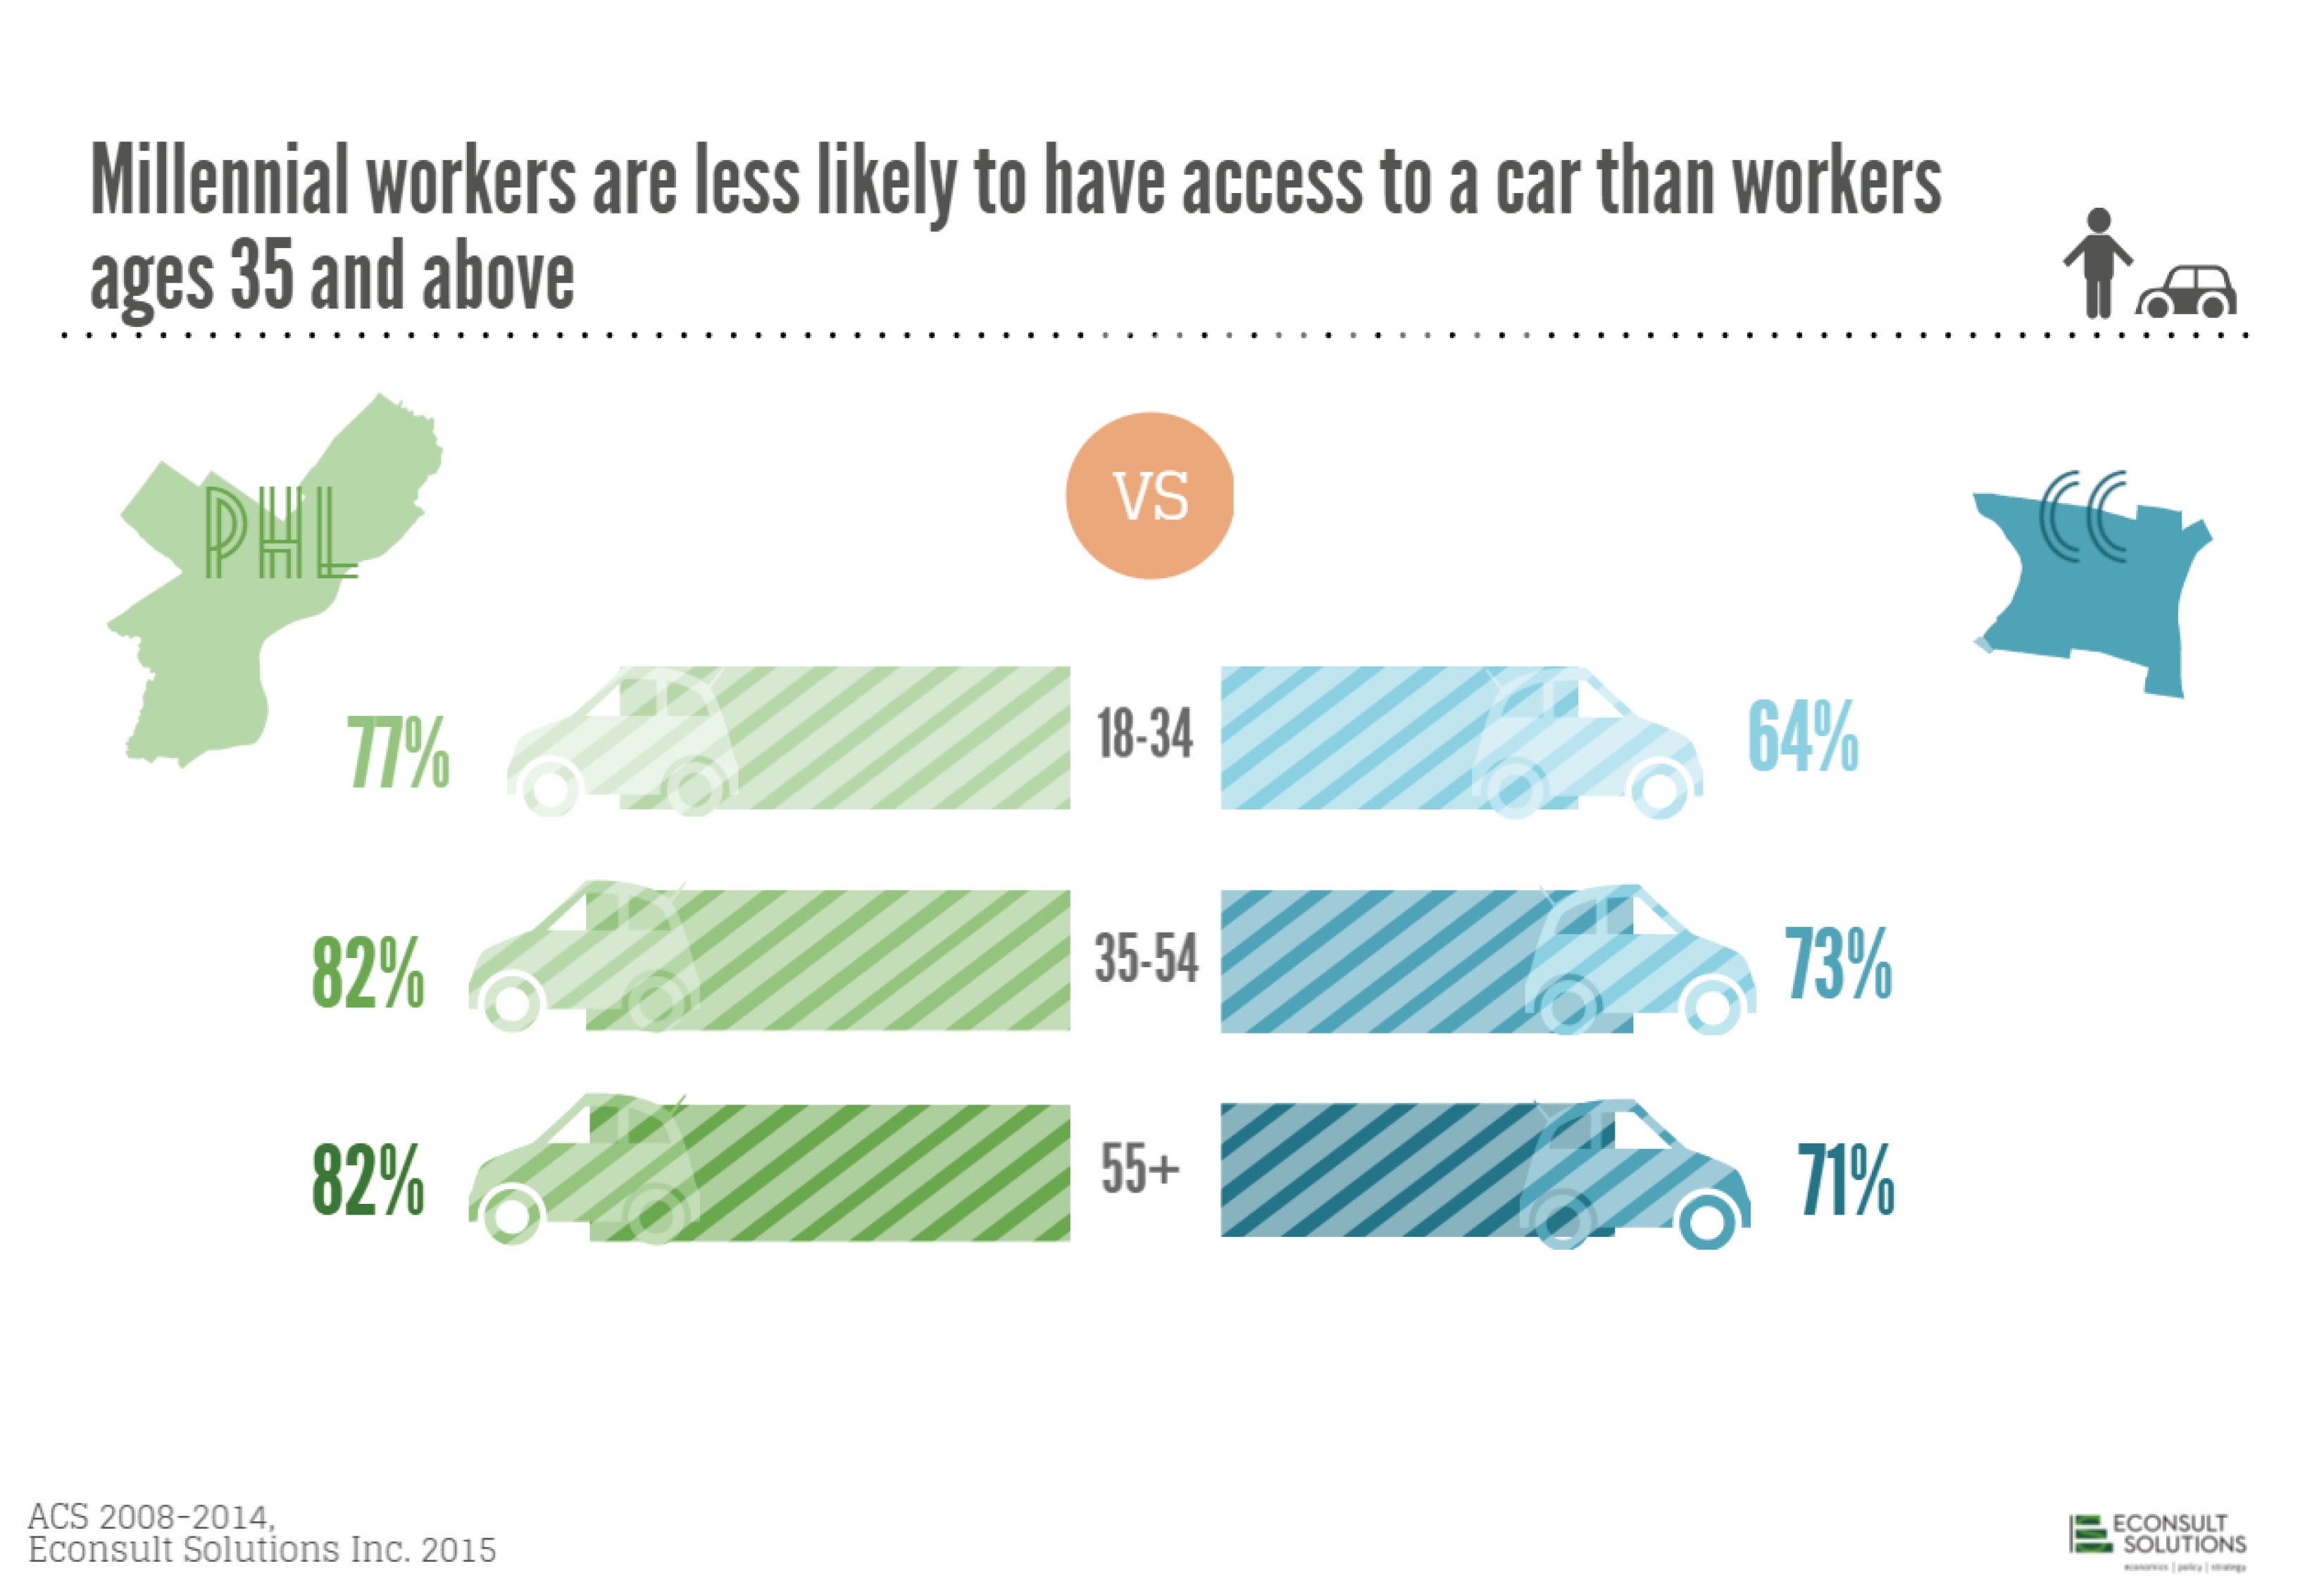
There have been lots of news stories about younger and newer workers driving less, and the data bears that out. Millennial workers, particularly in Center City, are less likely to drive than older workers.
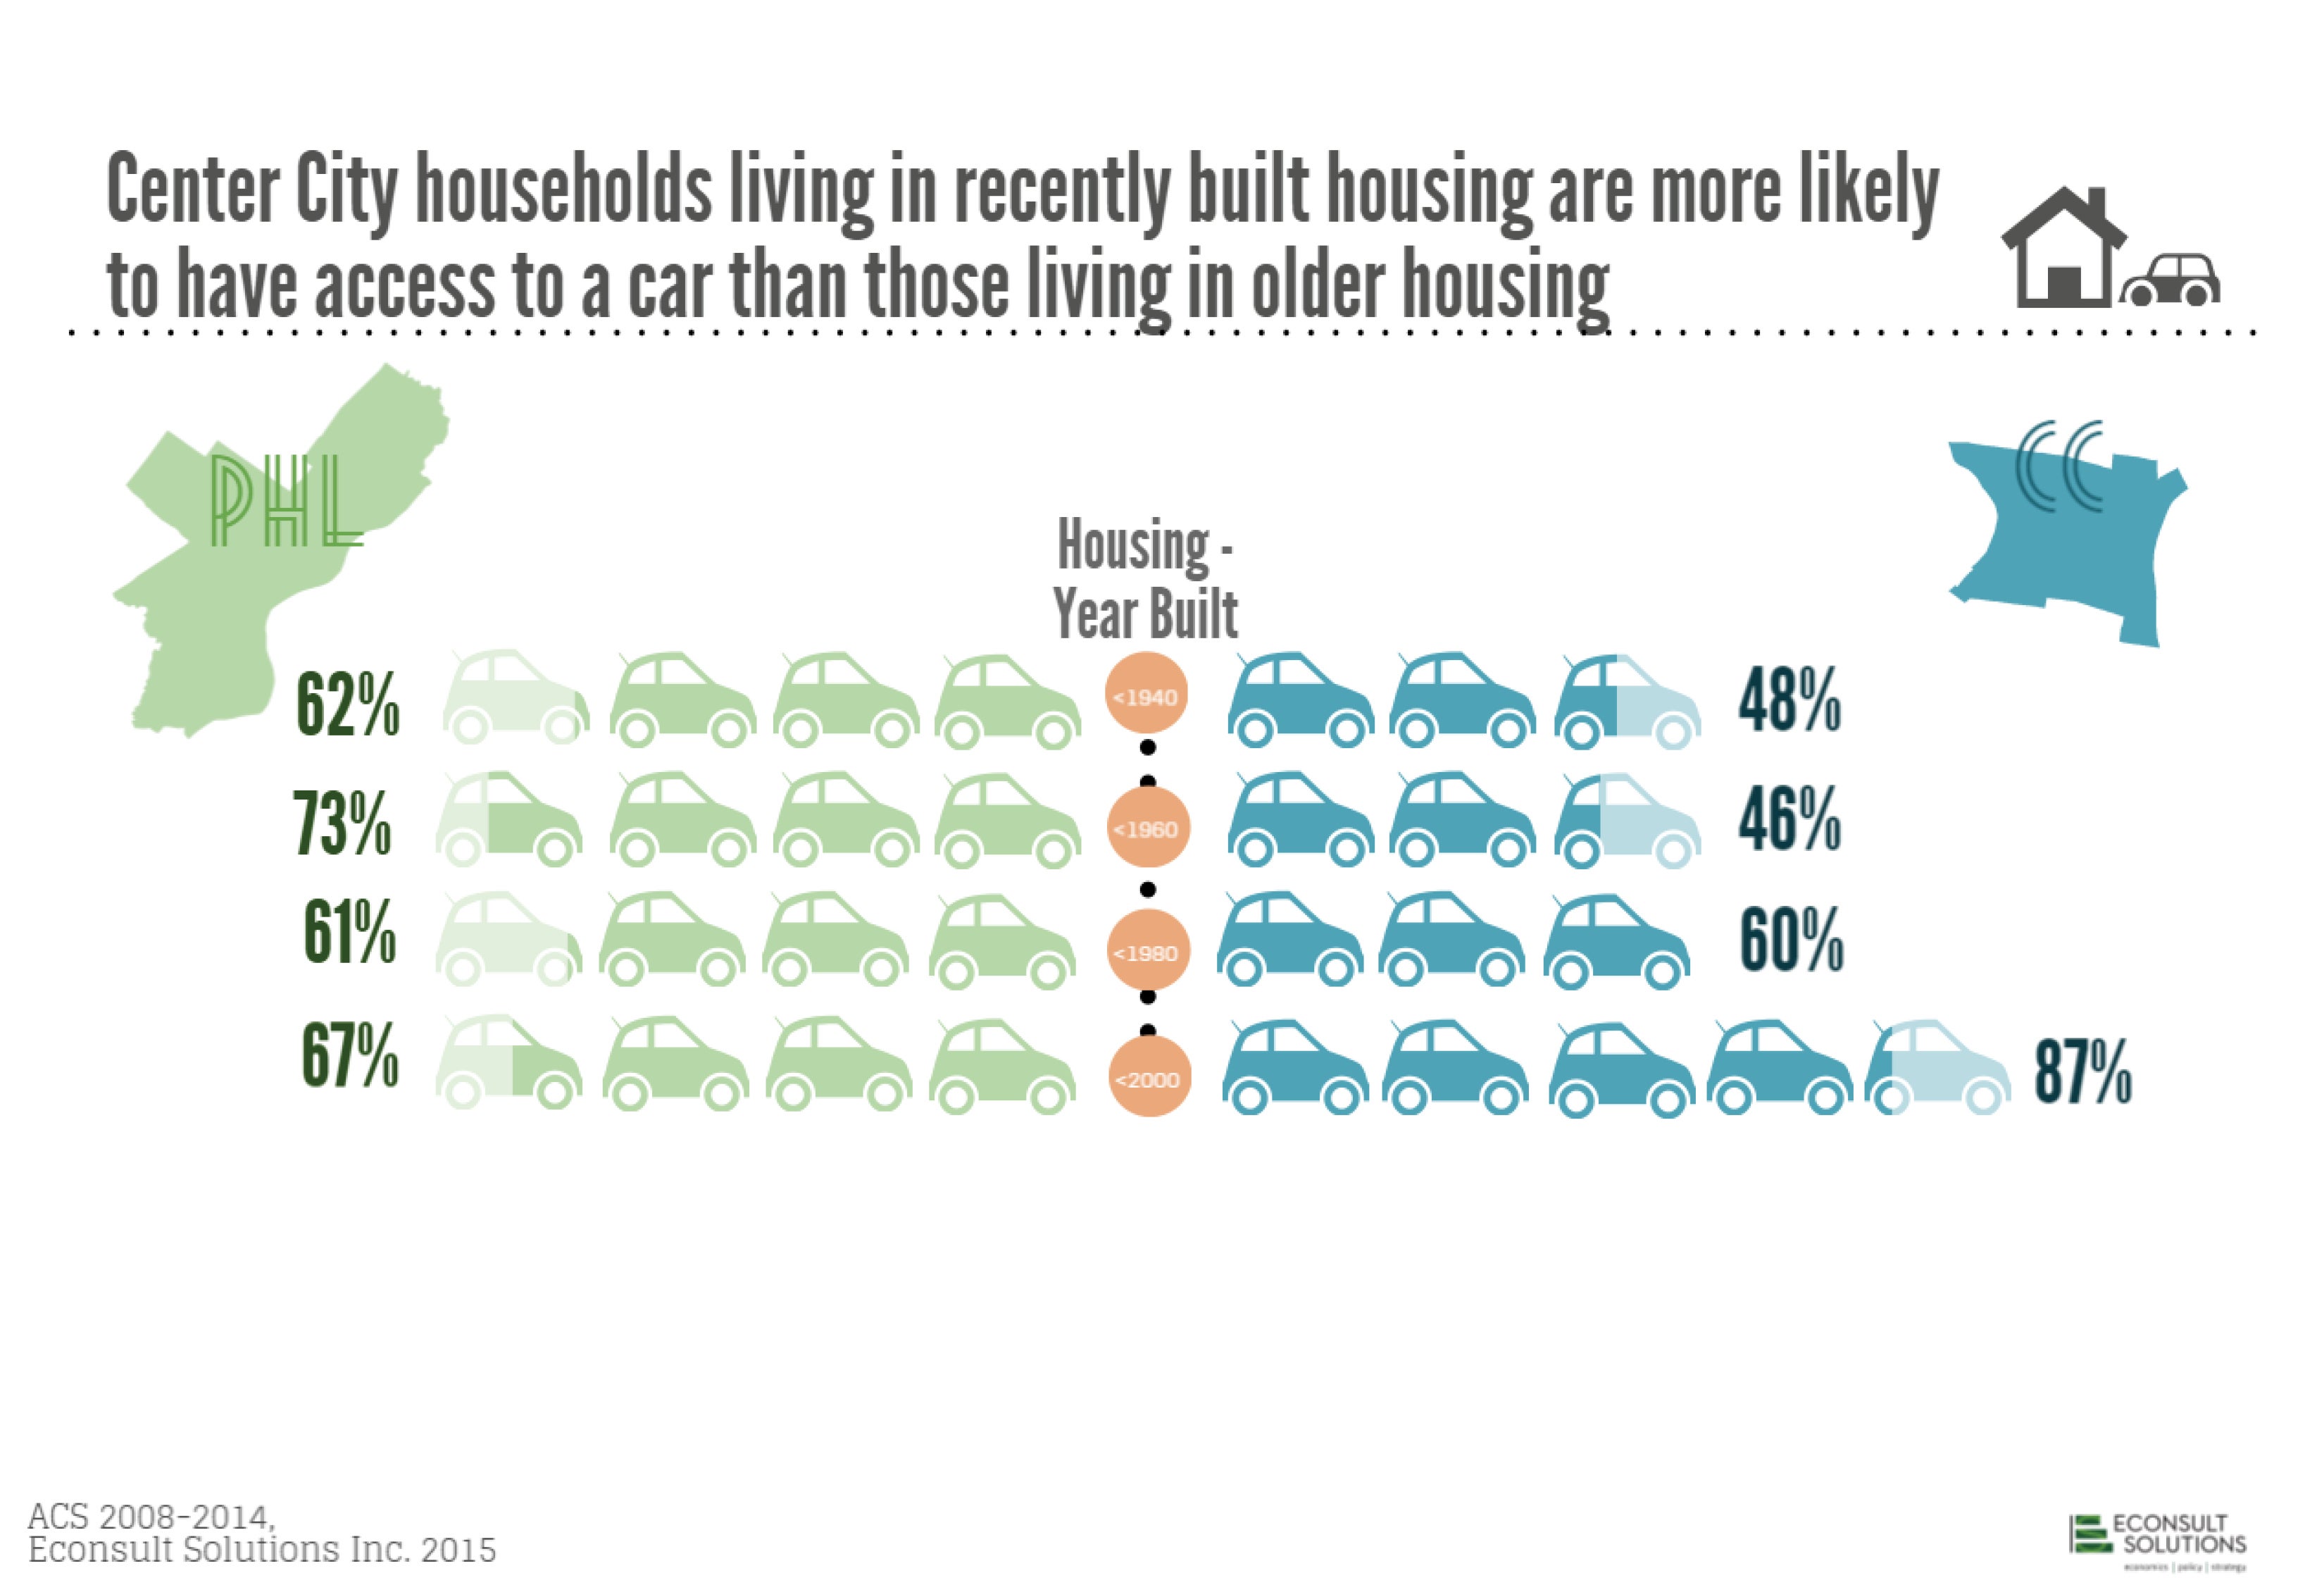
People who are able to afford new houses are generally richer than people who buy older houses that have been lived in before, so in one sense this is just another way of saying that higher income people are more likely to be car owners.
But it’s also an interesting statement about the real estate market. Despite the new zoning code’s clear intent to crack down on front-loading garages, and even though Philadelphians are driving less overall, home builders are still building homes for people who can afford to buy brand new homes, and those people are more likely to own cars.
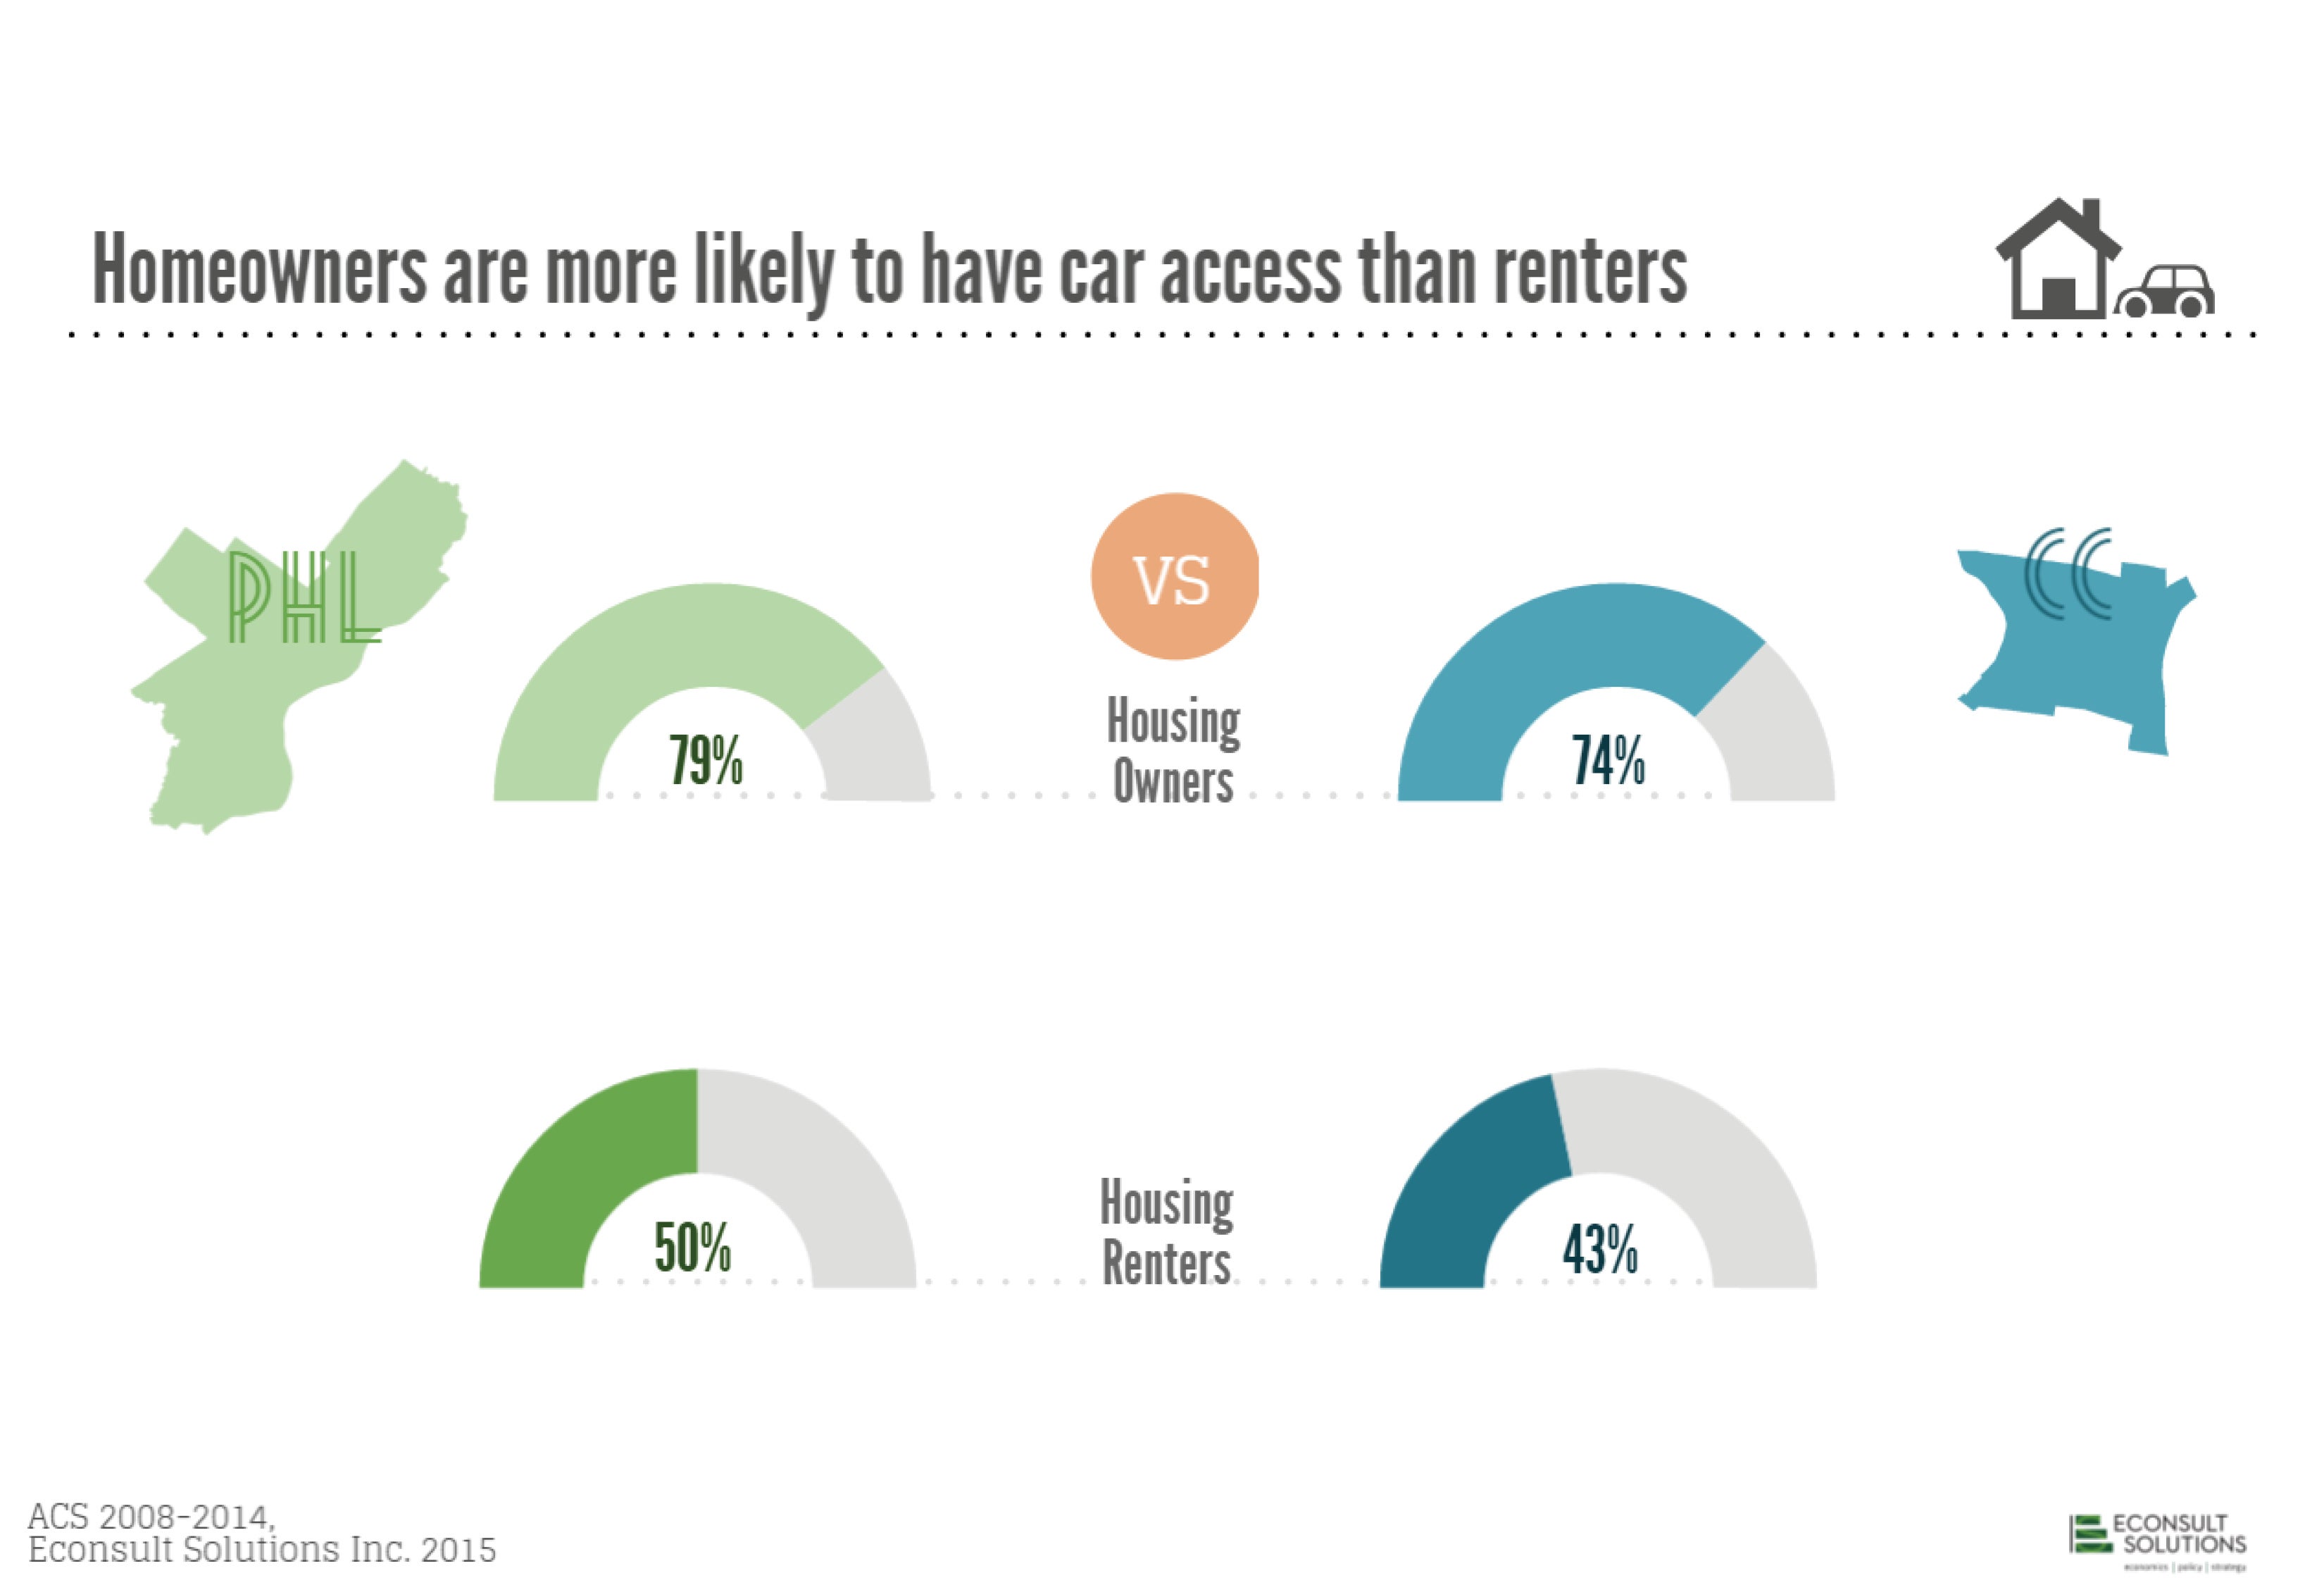
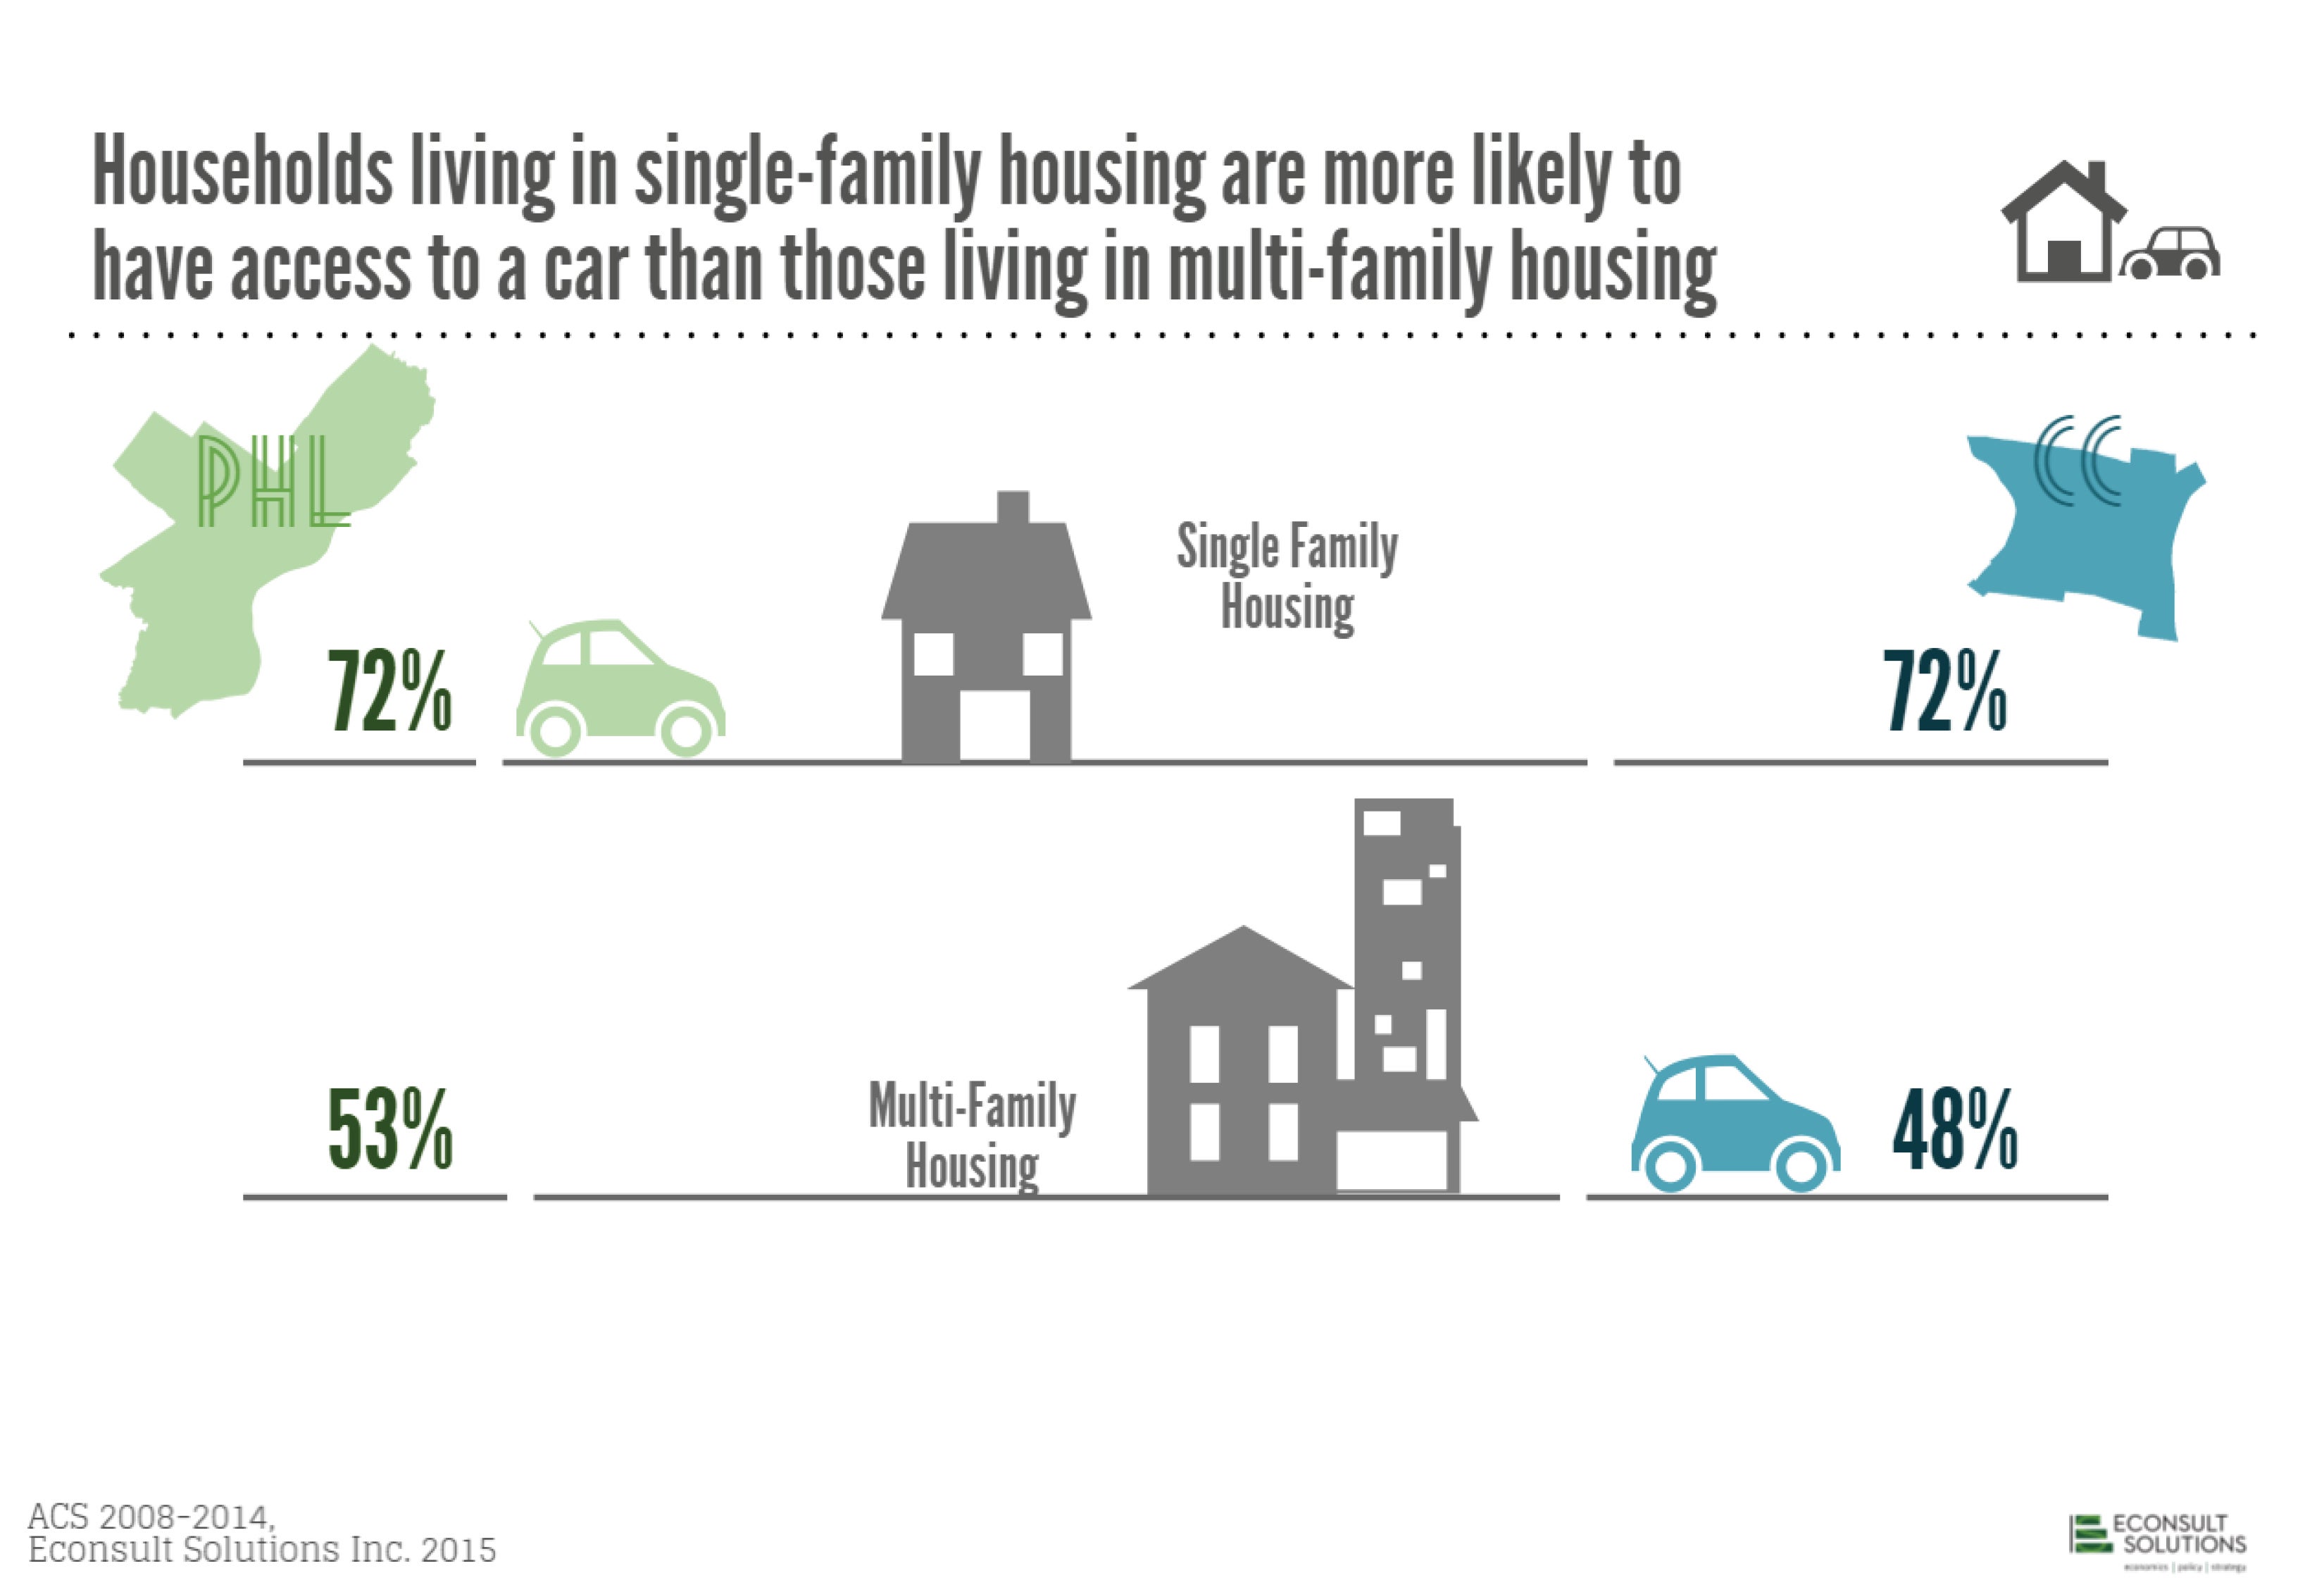
The next two graphics are interesting because of their implications for the debates over how much, if any, parking to require for multi-family housing. Those arguing against required parking like to point out that renters are a growing share of the population, and they are less likely to own cars than homeowners. People who live in multi-family buildings (most of which are rental apartments) are also less likely to own cars than people who live in single-family homes. In fact, multi-family housing dwellers account for the entire difference in car ownership rates between Center City and the city at-large.
Taken together, this looks like evidence for the case against the 1:1 or higher ratios of parking spaces to housing units that some community groups still ask of multi-family developers, despite the 2012 zoning code’s reduction in off-street parking requirements.
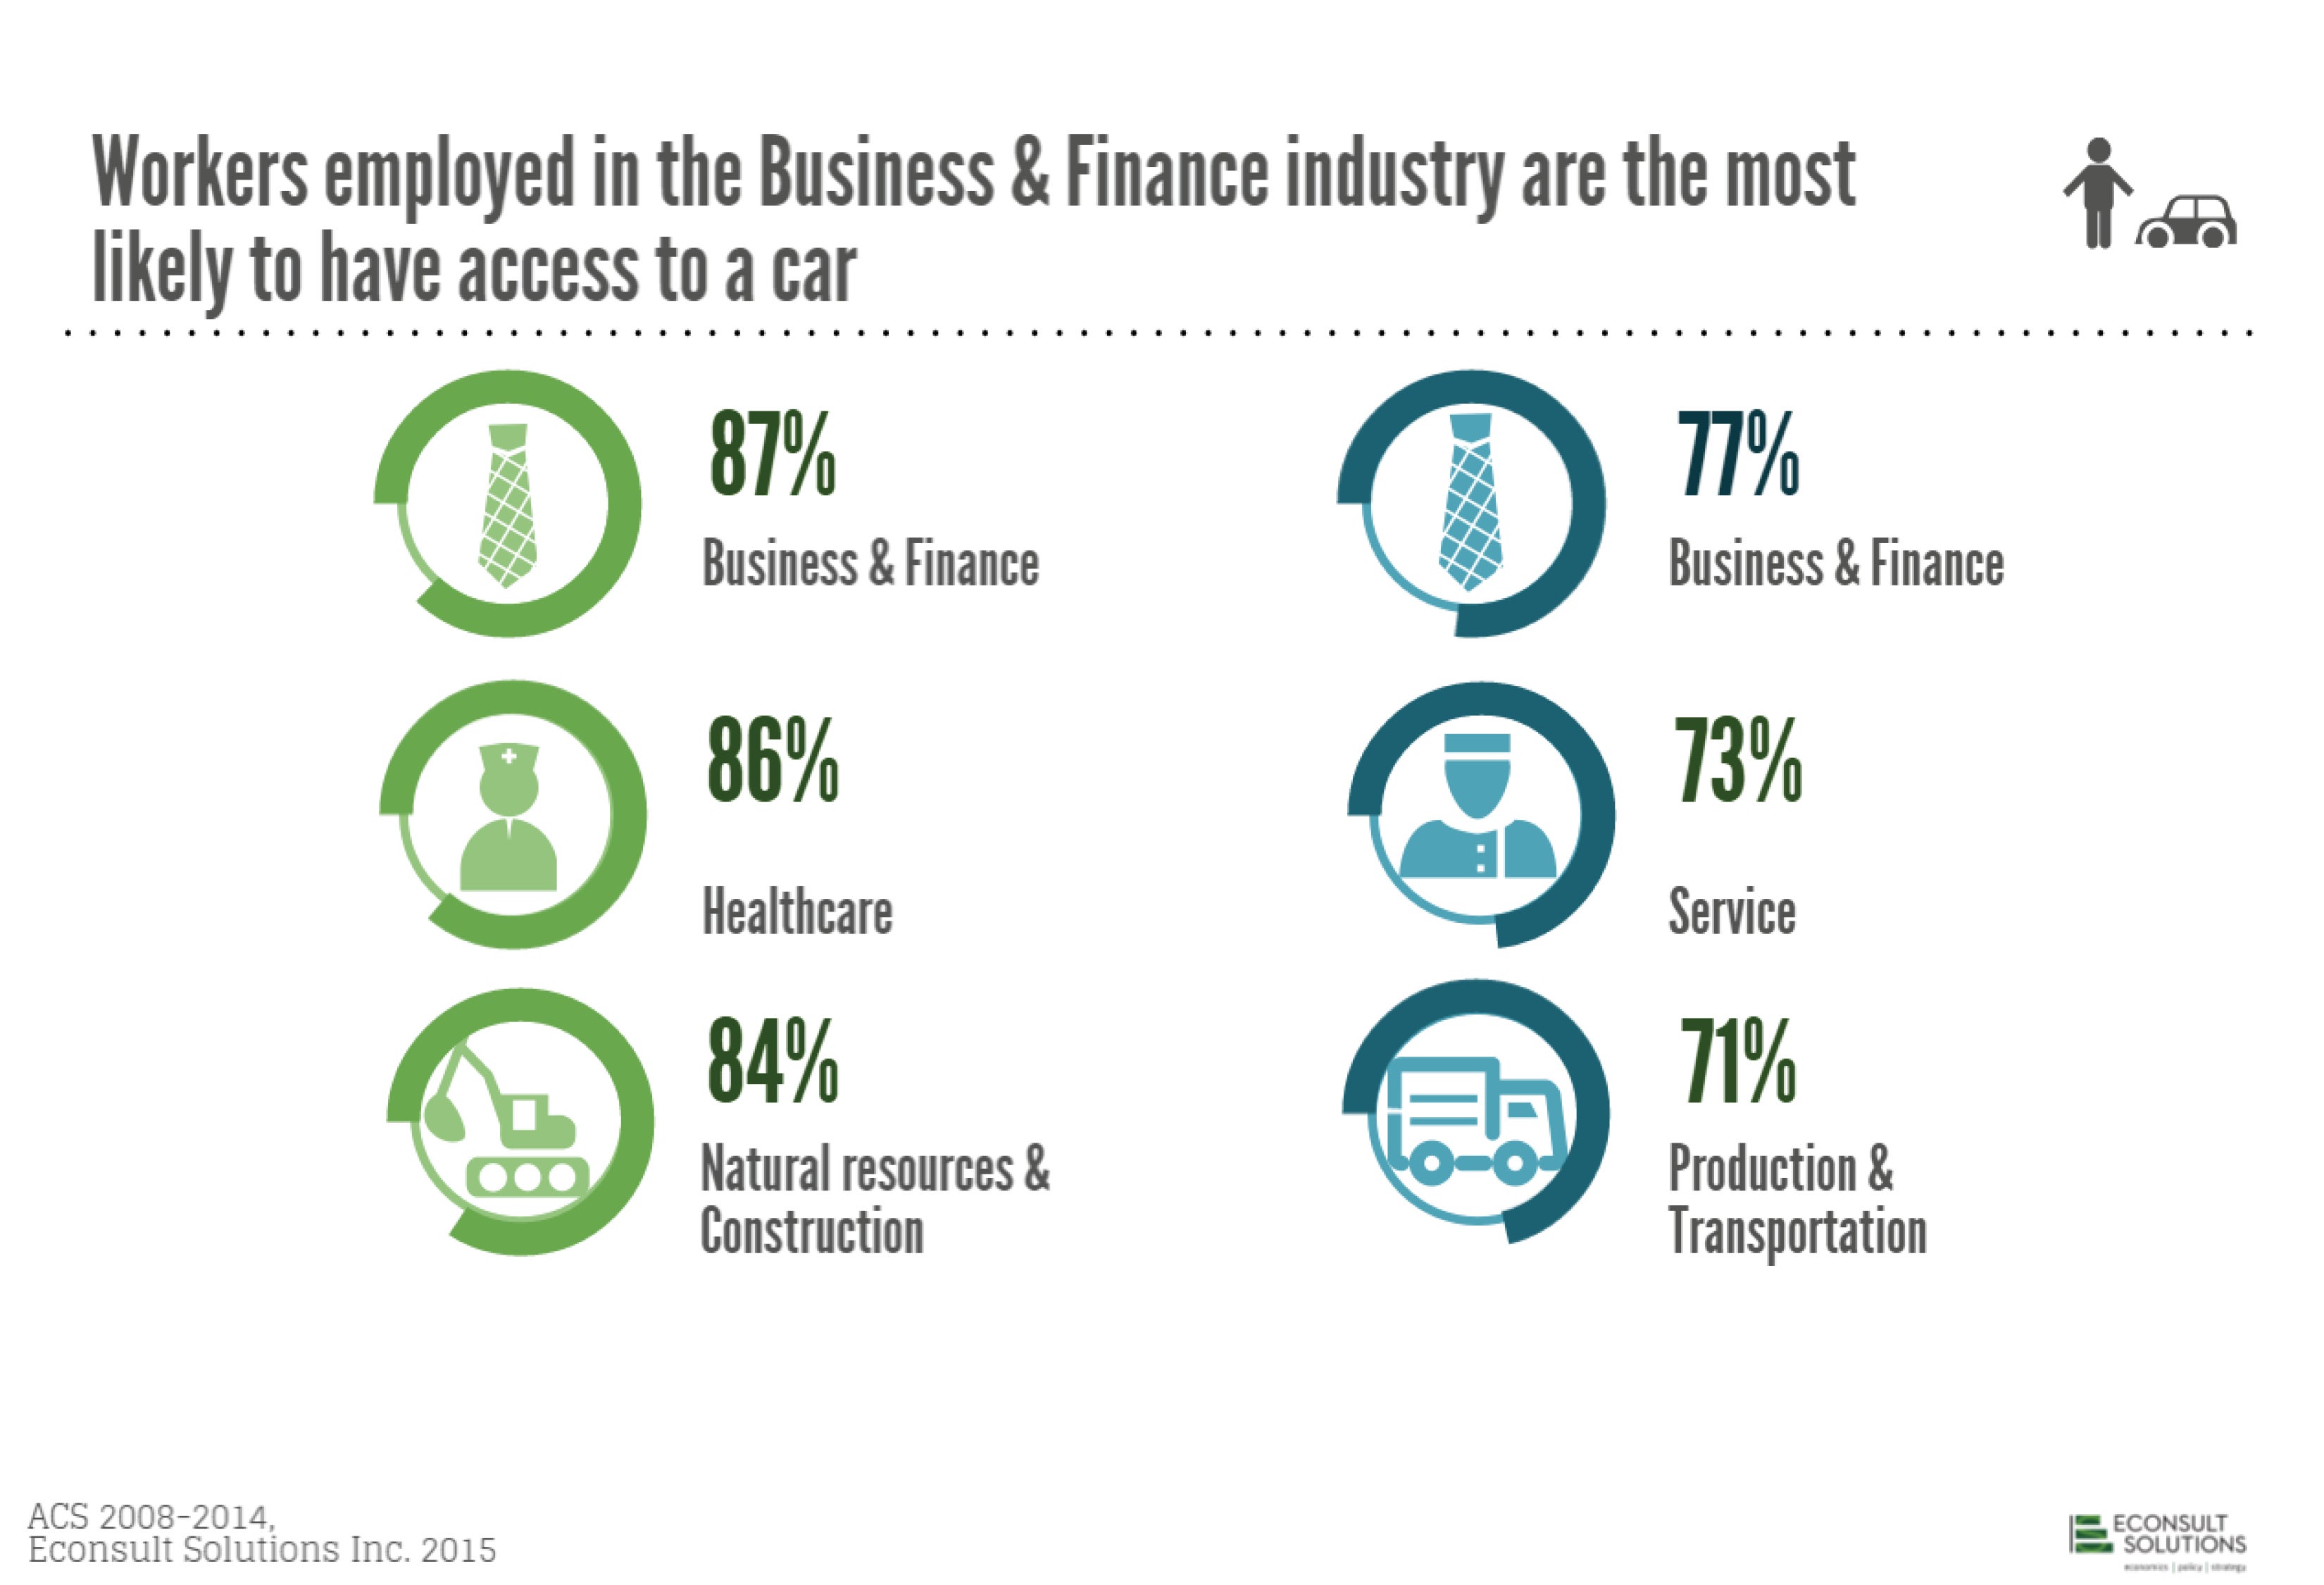
Occupation is another way to show the same income and class correlations that keep showing up over and over again: people with higher-paid, higher-status jobs are more likely to be car owners than people who work in lower-skill service economy jobs.
So there you have it: car owners are generally richer than non-car owners, younger multi-family apartment renters are less likely to be car owners than older single-family homeowners, and the more compact mixed-use land use patterns are associated with lower car ownership.
WHYY is your source for fact-based, in-depth journalism and information. As a nonprofit organization, we rely on financial support from readers like you. Please give today.
Brought to you by PlanPhilly

PlanPhilly
In-depth, original reporting on housing, transportation, and development.

SEPTA board approves budget and bus route changes
In the works for years, the changes are designed to streamline service and will cause some people to make multiple route changes to replace what was once a one-vehicle ride.
3 days ago
Listen 1:05
SEPTA gives families and groups easier fare payment options by expanding multitap
The goal is to give families and groups the ability to swipe in up to five people per fare instrument at a time.
3 weeks ago
Listen 0:53
DelDOT está utilizando las cámaras en las zonas de obras a lo largo de la I-95, y ahora los gobiernos locales han comenzado a instalarlas en los vecindarios.
1 month ago