How Philly’s charter schools stack up on PA’s performance measure

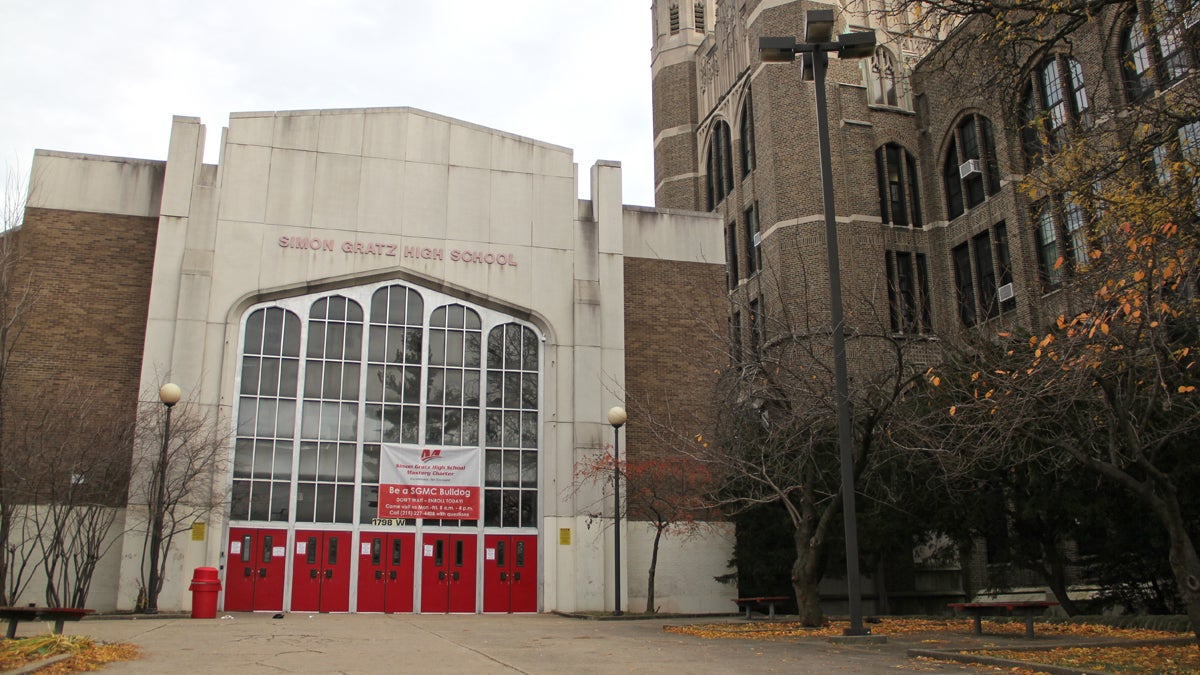
While performance on statewide tests remained low, Simon Gratz High School showed marked improvement in 2013-14. (Emma Lee/ NewsWorks)
The Pennsylvania Department of Education last week released its evaluation of the academic progress of the state’s public schools.
The School Performance Profile index is composed mainly of standardized test score results, but also takes into account attendance, graduation rates, and student improvement.
Last week, Newsworks published a story that analyzed overall state trends, as well as those in the Philadelphia School District.
Below is an analysis of Philadelphia’s 86 brick-and-mortar charter schools.
The average SPP score among all Philadelphia charters for 2013-14 is 64.1– dipping slightly from last year’s average SPP of 66.
(The district’s 214 schools have an average SPP score of 56.8 – again dipping slightly from last year’s average SPP of 57.5.)
Forty-two percent of the city’s charters saw their SPP scores increase compared to last year, while 58 percent saw decreases..
These trends are roughly on par with the trajectory of the district’s schools.
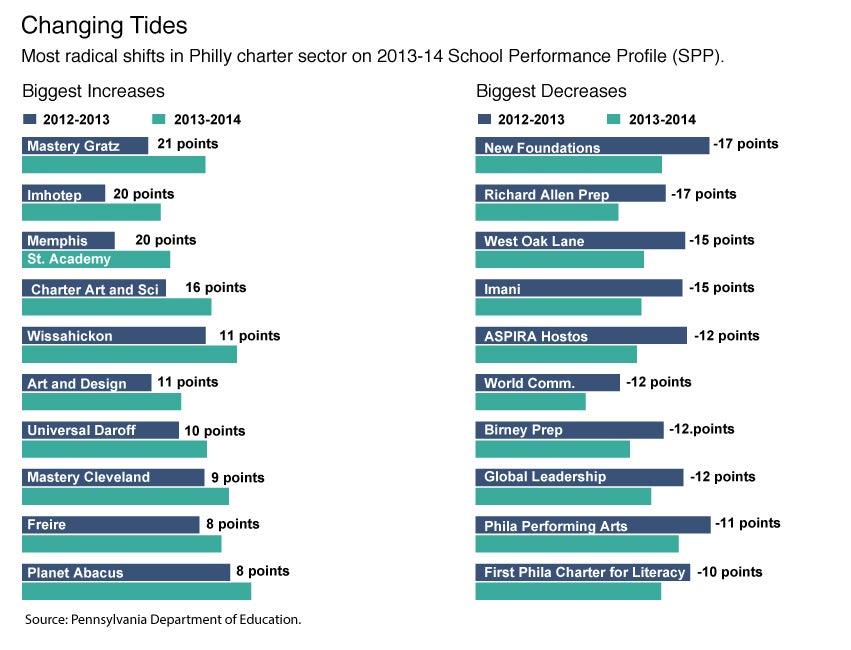
Here, we see the ten charter schools that saw the greatest gains and declines in SPP scores this year.

Mastery’s Simon Gratz, a renaissance charter that must serve all children within a defined neighborhood boundary, made the largest jump of any public school in the city.
Although Gratz’s proficiency rates on the Algebra, Literature and Biology Keystone exams are still very low, the state gave the Nicetown school high marks for academic growth.
Memphis Street Academy, a renaissance charter operated by American Paradigm, also made a significant leap in SPP standings, again, largely based on growth.
Here it’s worth probing a little deeper into how the SPP score is accumulated.
The graph below shows how a school that performs much better on the standardized tests, can receive an SPP score that’s only marginally better than schools with much lower test proficiency rates.
Science Leadership Academy, a district-run magnet school, received a 70.0 on the SPP. It’s proficiency rate on the Algebra Keystone was 79 percent, on the Literature Keystone was 91 percent and on the Biology Keystone was 43 percent.
Meanwhile, Mastery’s Gratz, received a 65 on the SPP with much lower proficiency rates: 27 percent for Algebra, 36 percent for Literature, and 16 percent for Biology.
|
School |
Algebra |
Literature |
Biology |
SPP Score |
|
Mastery Gratz (7-12) |
27% |
36% |
16% |
65.5 |
|
Science Leadership Academy (9-12) |
79% |
91% |
43% |
70 |
|
Memphis St. charter (5-8) |
18% |
25% |
10% |
52.9 |
|
Richmond Elem. (K-5) |
49% |
43% |
48% |
63 |
Also of interest is the performance of the city’s biggest charter school operators.
Of Mastery’s twelve schools given SPP scores, half saw declines compared to last year.
All of Aspira’s schools were downgraded on the SPP. In the Spring, the district had pushed for Aspira to assume control of Munoz-Marin Elementary through the Renaissance charter initiative. Parents voted in June to keep the school within district control.
Munoz-Marin’s SPP score dropped slightly from 46.2 to 45.8.
Aspira’s John Stetson Elementary, only a few blocks from Munoz-Marin, dropped from 57.3 to 48.8 on the SPP scale. Test scores favored Munoz-Marin in reading and science.
Of Universal’s seven charters, four experienced SPP declines.
Below is the list of the 83 city charters for which the state has assigned a 2013-14 SPP score:
jQuery{demo.css}
@media (max-width: 551px) {
#highchart_container {height: 3000px;}
}
@media (min-width: 550px) {
#highchart_container {height: 1400px;}
}
jQuery(function () {
jQuery(‘#highchart_container’).highcharts({
chart: {
type: ‘bar’
},
title: {
text: ‘Philadelphia Charter Schools by 2013-14 SPP score’
},
subtitle: {
text: ‘Source: P.A. Dept. of Education’
},
xAxis: {
categories: [‘Young Scholars Charter’,
‘Folk Arts-Cultural Treasures’,
‘Christopher Columbus’,
‘MaST’,
‘Franklin Towne HS’,
‘Laboratory Charter’,
‘Green Woods’,
‘Planet Abacus’,
‘Mastery Thomas’,
‘Mastery Shoemaker’,
‘Mastery Pickett’,
‘Ad Prima’,
‘Wissahickon CS’,
‘Philadelphia Academy’,
‘KIPP West Philly’,
‘Mastery Mann*’,
‘Independence’,
‘Russell Byers’,
‘Mastery Cleveland*’,
‘Philadelphia Performing Arts CS*’,
‘Franklin Towne Elem.’,
‘Pan-American ‘,
‘Prep Charter’,
‘Northwood Academy’,
‘Freire’,
‘Mastery Harrity*’,
‘Mastery Hardy Williams’,
‘Discovery Charter’,
‘Philadelphia Montessori’,
‘Alliance for progress’,
‘Community Academy ‘,
‘The Phila Charter Arts and Sciences’,
‘Multicultural’,
‘New Foundations’,
‘First Phila Charter for Literacy’,
‘Universal Daroff*’,
‘Mastery Gratz*’,
‘Harambee’,
‘Mastery Lenfest’,
‘Maritime’,
‘Khepera CS’,
‘Belmont Charter’,
‘Mariana Bracetti’,
‘Mastery Smedley*’,
‘Global Leadership’,
‘ASPIRA Pantoja’,
‘Mastery Pastorius*’,
‘West Phila. Achievement’,
‘Southwest Leadership’,
‘Mastery Clymer*’,
‘West Oak Lane CS’,
‘Sankofa Freedom’,
‘Imani’,
‘People for People’,
‘Universal Institute’,
‘Math, Civics,Science’,
‘Universal Creighton*’,
‘Philadelphia Electrical and Tech’,
‘Tacony Academy’,
‘ASPIRA Hostos’,
‘Charter for Arch and Design’,
‘Esperanza’,
‘Birney Prep*’,
‘Young Scholars Douglass*’,
‘Memphis St. Academy @ JP Jones*’,
‘Truebright’,
‘Richard Allen prep’,
‘Eastern University Charter’,
‘Wakisha’,
‘ASPIRA Olney HS*’,
‘Imhotep’,
‘Universal Bluford*’,
‘ASPIRA Stetson*’,
‘Universal Vare*’,
‘Young Scholars Kenderton*’,
‘Delaware Valley’,
‘Boys Latin’,
‘New Media’,
‘Universal Alcorn*’,
‘Walter Palmer’,
‘World Communications’,
‘Universal Audenried*’,
‘Arise Academy’],
title: {
text: null
}
},
yAxis: {
min: 0,
title: {
text: ‘*Renaissance charter school’,
align: ‘high’
},
labels: {
overflow: ‘justify’
}
},
tooltip: {
valueSuffix: ”
},
plotOptions: {
bar: {
dataLabels: {
enabled: true
}
}
},
/*
legend: {
layout: ‘vertical’,
align: ‘right’,
verticalAlign: ‘top’,
x: -40,
y: 100,
floating: true,
borderWidth: 1,
backgroundColor: ((Highcharts.theme && Highcharts.theme.legendBackgroundColor) || ‘#FFFFFF’),
shadow: true
},
*/
credits: {
enabled: false
},
series: [{
data: [89.2,
88.4,
87.7,
86.6,
86.1,
83.9,
83.8,
81.8,
81.5,
79.5,
79.5,
77,
76.7,
74.8,
74.7,
74.6,
74.1,
74.1,
73.9,
72.5,
72.4,
72.4,
71.9,
71.7,
71.2,
70.2,
69.9,
69.8,
69.8,
69.4,
67.9,
67.6,
66.9,
66.5,
66.2,
66,
65.5,
65.5,
65.1,
64.7,
64,
63.9,
63.2,
62.8,
62.7,
62.5,
62.1,
62,
61.1,
60.1,
60.1,
60,
59.2,
58.8,
58.6,
58.3,
58.2,
58.1,
57.8,
57.6,
56.8,
56.8,
55.1,
53.2,
52.9,
51.4,
51,
50.5,
49.7,
49.6,
49.5,
49.5,
48.8,
48.3,
47.7,
46.7,
46.3,
43.7,
42.0,
39.8,
39.3,
38.1,
31.2],
name: ‘School Performance Profile (SPP) Score’
}]
});
});
WHYY is your source for fact-based, in-depth journalism and information. As a nonprofit organization, we rely on financial support from readers like you. Please give today.


