


Everything you wanted to know about Pennsylvania’s new education formula


Pennsylvania Governor Tom Wolf signed into law a new education formula for distributing increases in state aid money to school districts in the commonwealth. Students of Science Leadership Academy at Beeber High School leave the school in Philadelphia
But were too afraid to ask.
But were too afraid to ask
Last week, Pennsylvania Governor Tom Wolf signed into law a new formula for distributing state education money.
As a general rule, public school money that comes from the state is meant to help level the playing field for districts who have a harder time generating local revenue.
A state formula is the tool used to decide how the pie of money should be sliced. In effect, it’s the state’s way of acknowledging which districts need the most help.
The tenets of this newly enacted formula were agreed to by a bipartisan commission in June 2015 and passed by both houses of the General Assembly with overwhelming majorities recently.
Most advocates call this a major step forward — as the state had been one of only three in the nation lacking a student-weighted formula.
By counting actual enrollment shifts and acknowledging that some districts must spend more to educate their children, the formula adds predictability to a system that’s often been swayed by the political powers of the moment.
But lawmakers plan to use the formula to disperse only new increases in aid — locking in the disparities that were created through decades of non-formula-based distributions.
This year, of a $5.6 billion budget, the general assembly sent about $152 million through the formula — less than 3 percent.
The formula also does not calculate how much money it takes to ensure that all students can meet state academic standards. That “adequacy” question is one the creators of the formula specifically avoided.
A journey through the past
With the exception of a three year period from 2008-2010, Pennsylvania has not used a student-weighted formula to distribute its main pot of education cash since 1991, when a rule called “hold harmless” became king.
Under that rule, the state did not acknowledge actual enrollment changes or demographic shifts, and typically provided all districts with 2 percent funding increases.
Districts that shrunk in enrollment saw per pupil funding rise, while those that grew saw per pupil funding diminish. Some “fiscally distressed” school districts garnered additional supplements, but, by some estimates, 53 percent of 2013-14 basic education funding can be traced back to 1990-91 enrollment data.
For many districts, this dynamic exacerbated inequities that grew through the 1970s and 1980s. In 1971, state government provided about 54 percent of public school revenue. By 2000, that share dropped to about 35 percent, which is about where it sits today.
As a result, schools have grown increasingly reliant on local property taxes — a system that’s created wide disparities between the state’s wealthiest and poorest districts.
How the formula works
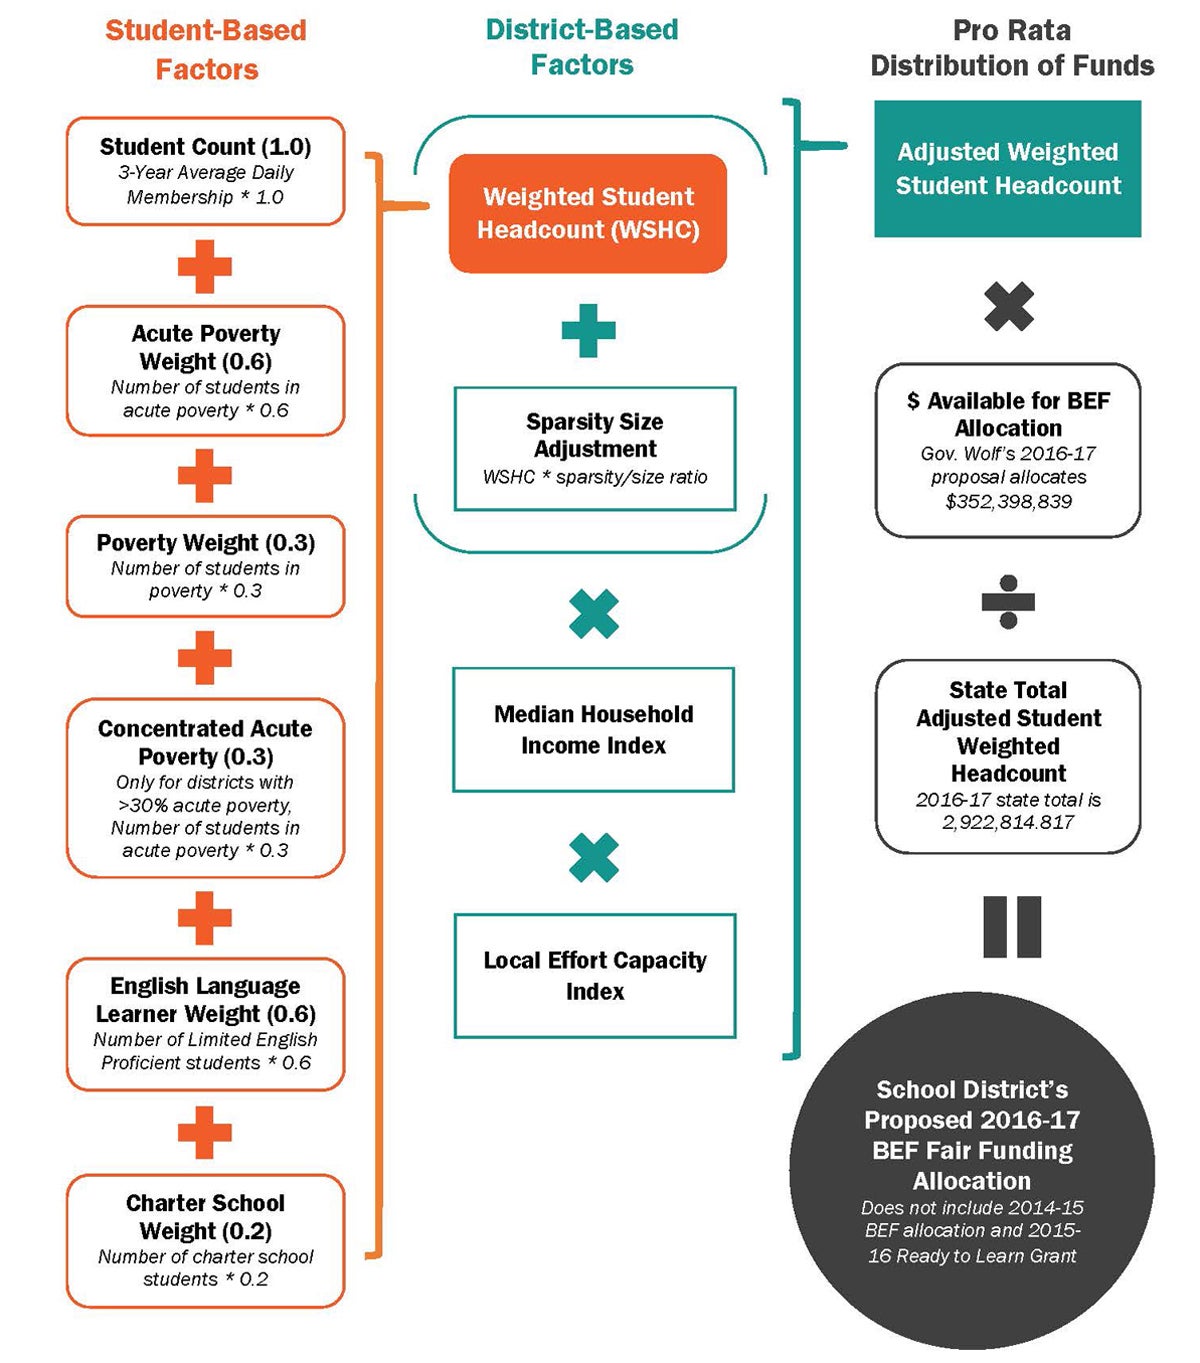
The new formula is designed to ease inequities by recognizing that districts face different challenges depending on student demographics and other geographic and economic factors.
Based on an April 2015 survey completed by 80 school districts and 14 charter schools, the commission came up with “weights” for eight of these factors.
How these weights affect school districts will change every year, based on local demographic and economic shifts.
It’s important to note that formulas are not made in a vacuum. Politicians carefully decided which factors to measure and how much weight to give each before settling on a final plan.
On both sides of the aisle, lawmakers and state officials were running different permutations of the weights to gauge how their preferred districts would fare.
(Graphic Courtesy of Research for Action)
Digging into the details
The formula begins with the premise that districts with more students should receive more funding than districts with fewer students. In order to make funding more stable and less susceptible to sudden swings in enrollment, the formula uses a three-year average.
Starting from this enrollment figure, the formula then applies weights based on student factors that, in effect, add to that number.
After accounting for these student-based factors, the formula then considers district-based factors to come up with an “adjusted weighted student headcount.”
After considering district wealth and local school tax burden, this final number can actually come out to be smaller than actual enrollment.
To illustrate how the metric works, we’ll compare two vastly different districts.
In Reading — a poor, urban district which receives about 72 percent of its funding from the state — the three-year average enrollment is 18,096.
In New Hope-Solebury in Bucks County — a wealthy suburban district which gets about 15 percent of its funding from the state — enrollment is 1,509.
Student-based factors
Poverty
Like more than 25 states that provide increased funding for economically disadvantaged students, Pennsylvania’s formula recognizes that low-income students require additional support and services.
Most of those states use student eligibility for Free and Reduced Price Lunch as the primary poverty identifier. Pennsylvania, though, decided to use U.S. Census data in order to give added weight to students living in poverty or acute poverty.
Students in poverty (100-184% of the federal poverty level) are given an additional weight of 0.3.
Students in acute poverty (0-99% of the federal poverty level) are given an additional weight of 0.6.
If a district’s catchment area has 30% or more of its residents living in acute poverty, those students receive an additional 0.3 weight. So, the formula gives districts a total additional weight of 0.9 for each student living in concentrated acute poverty.
Based on these weights, Reading received an added 10,397 students in the formula’s metric, whereas New Hope-Solebury received an extra 66 students.
English Language Learners
The Commission reported that 42 states direct additional funding to English Language Learners, who typically need specialized, more costly instruction.
The Commission weighted ELLs an additional 0.6 in their formula.
Based on this weight, Reading received an added 1,962 students, whereas New Hope-Solebury received an extra 12 students.
Charter School Enrollment
Districts with larger numbers of students enrolled in charters also receive more funding under the formula. This is in order to help offset the stranded costs of students leaving public schools that arise due to smaller class sizes or, according to the commission, “other technical factors.”
The Commission settled on a weight of 0.2 based on the survey results of the 80 school districts that responded. They reported, on average, that in a hypothetical situation where 10 percent of their students departed to a charter school, they would spend an extra 18 cents per dollar for every student attending a charter compared to one who stayed in the district.
Based on this weight, Reading received an added 211 students in the formula’s metric, whereas New Hope-Solebury received an extra 1.4 students.
In total, adding all student-weighted factors, Reading’s enrollment jumps to 30,667, a 69 percent increase over its actual.
New Hope-Solebury’s enrollment goes to 1590, a 5 percent increase over its actual.
District-based factors
Sparsity-Size Adjustment
The sparsity-size adjustment is included, the commission writes, in order to recognize “the challenges of providing educational services in districts that lack economies of scale.”
It benefits only the 150 most remote, rural school districts.
The sparsity-size ratio is composed of two different ratios — one for sparsity and one for size.
The sparsity ratio is based on a district’s number of students per square miles. The size ratio is based on the district’s number of students divided by the average number of students in all 500 school districts. Sparsity counts for 40% of the sparsity-size ratio and size counts for the remaining 60%.
Neither Reading or New Hope-Solebury receives a sparsity-size adjustment.
Everett Area School District in Southwest Pennsylvania, which serves about 1,300 students over about 300 square miles, got the largest such boost in 2015-16.
Median Household Income Index
The formula also accounts for Median Household Income, which measures local household income in relation to the rest of the state.
The index is calculated by dividing a district’s median household income by the state’s median and then dividing 1 by that number.
Thus, if a district’s median household income is half of the state’s median, its MHII would be 2.
That’s about where Reading sits. It has the third-highest index score in the state, 1.977.
Inversely, if a district’s median household income is double the state’s median, its MHII would be 0.5.
With a .488 index score, New Hope-Solebury’s median household income is more than twice the state median.
These index numbers are then multiplied by the student-weighted enrollment numbers as mentioned above.
So Reading’s tally jumps to 60,629, while New Hope-Solebury’s falls to 776.
Local Effort Capacity Index
TThe last step in the formula is Local Effort Capacity Index, which is the sum of two separate indices: the Local Effort Index and the Local Capacity Index.
The Local Effort Index looks at how much a district taxes its residents compared to the state median. But then, in order not to reward wealthier districts, it then makes adjustments for districts that are spending more than the state median on schools.
Lancaster makes out really well on this measure. It’s in the top five percent districts in terms of local tax effort per household, but it still spends less than the state average on schools.
Three districts in the Pocono Mountain Area also rank in at the top of this list. Pocono Mountain, Stroudsburg and East Stroudsburg all have seen local property taxes balloon as student enrollment increased over the past few decades without requisite increases in state funding.
Residents there are taking on so much tax burden per household that – even though they spend above the state average on schools – this metric rates them highly.
The Local Capacity Index measures how much money a district could spend per student if it taxed its residents at the median statewide rate.
Districts already spending at or above the median receive a zero on this scale. In 2015-16, 253 districts were in this category.
Reading, York, Duquesne, Chester-Upland and Shenandoah Valley in Schuylkill County are recognized by the formula as having the least local capacity to generate revenue for schools – based largely on their low property values.
When the two metrics are combined, the formula says York, Harrisburg, Pocono Mountain, Lancaster and Allentown pay the most in school taxes in proportion to their ability to do so.
So how does this all affect Reading and New Hope-Solebury?
Reading gets a Local Effort Capacity Index score of 1.84, while New Hope receives a .61.
Conclusion
When multiplied by their median household income scores, Reading’s adjusted student weighted enrollment jumps to 111,557. That’s 6.1 times its actual enrollment – the 3rd highest multiple in the state.
New Hope-Solebury’s number falls to 473. That’s 31 percent of its actual figure, the second steepest drop.
With these final adjustment numbers in hand, the state then simply divides funding accordingly.
Reading’s final enrollment number represents .038 percent of the state’s entire number. So it gets .038 percent of the funding.
So this year, out of $152 million that went through the formula, Reading received $5.8 million.
With .0001 percent of the state’s adjusted student-weighted population, New Hope-Solebury received a corresponding $24,688 in new funding through the formula.
New Hope-Solebury’s number may seem low, but it actually represents a 2.17 percent increase over its prior year state funding, which is better than the majority of districts in the state.
Why?
It all comes back to counting actual enrollment. New Hope-Solebury’s student population has nearly doubled since 1990-91, when “hold harmless” went into effect.
So even after all the other twists and turns of the formula, the fact that the state now counts students means that the district made out pretty well compared to the past.
Reading’s enrollment also grew in the past 25 years. So it’s been feeling the added whammy of serving growing numbers of needy students over the past few decades without the state systematically considering the number or the need.
Allentown, Lancaster, Hazelton, York, Philadelphia, Erie, Panther Valley, Shenandoah Valley and many other distressed districts know the feeling.
Below are tables that illustrate how the formula worked in the 2015-16 budget.
Top 10 districts by total amount of revenue provided by the new formula
|
Philadelphia City SD |
$35.9 million |
|
Reading SD |
$5.8 million |
|
Allentown City SD |
$4.3 million |
|
York City SD |
$2.7 million |
|
Lancaster SD |
$2.6 million |
|
Erie City SD |
$2.6 million |
|
Pittsburgh SD |
$2.3 million |
|
Harrisburg City SD |
$2 million |
|
Chester-Upland SD |
$1.8 million |
|
Scranton SD |
$1. 7 million |
Bottom 10 school districts by total amount of revenue provided by the new formula
|
Bryn Athyn SD* |
$58 |
|
Austin Area SD |
$20,357 |
|
Avella Area SD |
$21,148 |
|
Salisbury-Elk Lick SD |
$21,974 |
|
Jenkintown SD |
$22,468 |
|
New Hope-Solebury SD |
$24,688 |
|
North Clarion County SD |
$28,319 |
|
Millersburg Area SD |
$32,463 |
|
Fannett-Metal SD |
$33,345 |
|
Commodore Perry SD |
$33,614 |
*Bryn Athyn serves a very small population and outsources school services
Top 10 districts by percentage increase in state funding based on new formula
|
Conestoga Valley SD |
11.28% |
|
York Suburban SD |
9.67% |
|
Wyomissing Area SD |
9.34% |
|
Derry Township SD |
8.94% |
|
Hanover Public SD |
8.88% |
|
Jim Thorpe Area SD |
8.68% |
|
State College Area SD |
7.32% |
|
Quaker Valley SD |
7.29% |
|
Manheim Township SD |
7.17% |
|
Upper Merion Area SD |
6.75% |
Bottom 10 districts by percentage increase in state funding based on new formula
|
Bryn Athyn SD |
0.17% |
|
South Side Area SD |
0.43% |
|
Avella Area SD |
0.50% |
|
Conemaugh Township Area SD |
0.71% |
|
Allegheny-Clarion Valley SD |
0.75% |
|
Fort Cherry SD |
0.76% |
|
Riverside Beaver County SD |
0.76% |
|
Susquenita SD |
0.77% |
|
Western Beaver County SD |
0.79% |
|
Forest Hills SD |
0.81% |
Top 10 districts by per pupil increase based on new formula
|
Duquesne City SD |
+$372 |
|
York City SD |
+$353 |
|
Reading SD |
+$323 |
|
Harrisburg City SD |
+$273 |
|
Chester-Upland SD |
+$257 |
|
Midland Borough SD |
+$233 |
|
Lancaster SD |
+$230 |
|
Sto-Rox SD |
+$230 |
|
Shenandoah Valley SD |
+$224 |
|
Sharon City SD |
+$222 |
To get a sense why there has been such a clamor for a student-weighted formula, compare the table above with the one below.
Remember, the formula was only used this year to divide a tiny fraction of total state aid, and thus many districts are still benefiting from the “hold harmless” provision.
Top 10 districts by total state per pupil funding in 2015-16
|
Duquesne City SD |
$14,089.05 |
|
Farrell Area SD |
$9,094.71 |
|
Purchase Line SD |
$8,986.11 |
|
Union SD |
$8,960.38 |
|
Harmony Area SD |
$8,873.03 |
|
South Side Area SD |
$8,728.11 |
|
Chester-Upland SD |
$8,567.27 |
|
Austin Area SD |
$8,472.94 |
|
Cameron County SD |
$8,433.01 |
|
Oswayo Valley SD |
$8,276.42 |
So yes, the state is still sending more basic education money per pupil to kids in South Side Area – which is in the top fifth of median household income – than it does to Reading and York, which are in the bottom 1 percent.
Because lawmakers plan to use the formula only to distribute new funding increases, if $200 million was added each year, it would take more than 25 years for the bulk of state education aid to be distributed fairly.
WHYY is your source for fact-based, in-depth journalism and information. As a nonprofit organization, we rely on financial support from readers like you. Please give today.
Brought to you by Keystone Crossroads
Keystone Crossroads
Exploring the stories that matter across the commonwealth with all Pennsylvanians in mind.