

Why do rates of global sea level rise vary locally?
Listen
A National Oceanic and Atmospheric Administration map showing where sea levels are rising and where they're falling. The colors represent the rate of change. (NOAA)
One of the most visible signs of climate change is rising seas. Coastal cities have seen more frequent and larger storms – think Hurricane Sandy – and there are places where water is drowning land.
Seas are rising because glaciers and ice sheets around the world are melting. Water that used to be frozen solid on land is pouring into the ocean. The rate of melt is increasing: it’s faster than it has been in the past and largely attributed to the human-driven creep upward of global temperatures.
In addition, the higher temperatures are causing the oceans to warm, and when water heats up it expands and takes up more room in the ocean basin.
This kind of global fluctuation in the quantity of seawater is called eustatic change.
But there’s another, more localized way to look at sea level rise, one that takes into account shifts in sea level and land, as well as other processes. This relative sea level rise calculation gives a more accurate account of how any particular area could experience the global phenomenon of sea level rise.
Measuring locally
“What the global average does is give us a baseline from which we can look at the variations regionally,” said Dork Sahagian, a climate scientist who teaches at Lehigh University in Pennsylvania.
Climate scientists calculate that the average global rate of sea level rise at this time is just over 3 millimeters per year, the thickness of about two stacked pennies. But the world’s ocean basins are not a tub that fills up at the same rate when the glacier melt pours into them — there’s variation from point to point on a map.
Some of this variety has been captured by a network of tide gauges operated by the National Oceanic and Atmospheric Administration. Initially installed in ports to track tides, some of the gauges have been working for more than 100 years and have inadvertently recorded the slow rise of seas.
Atlantic City, NJ is one place that has a long-running tide gauge. On an early spring morning, the city was quiet except the sound of construction on the boardwalk in preparation for summer. The tide is installed on Steel Pier, a tongue of cement stretching into the Atlantic Ocean on stilts, home to bright lights and big rides, once owned by Donald Trump and anointed by The Beatles.
Ben Horton, a coastal geologist who teaches at Rutgers University, picked his way between disassembled amusement rides and construction trailers, to get to the gauge.
“The tide gauges are relatively simple pieces of apparatus. They basically just record the height from a sensor to the water level. It’s continuous,” Horton said.
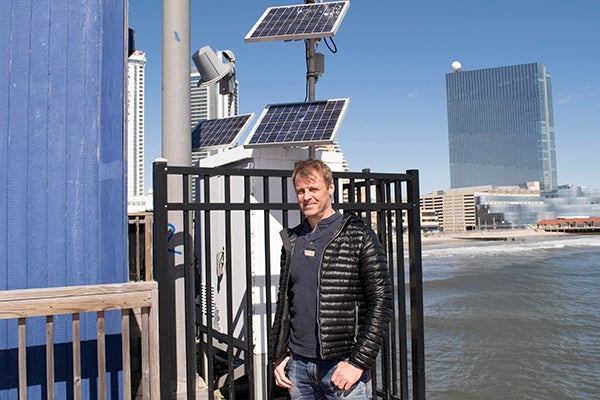
Ben Horton, coastal geologist at Rutgers University, standing by the Atlantic City tide gauge on Steel Pier, in Atlantic City, NJ. (Irina Zhorov/WHYY)
The Atlantic City gauge shows that here, sea level appears to be rising around 4 millimeters annually. That’s faster than the 3 mm global average.
Go up to Bar Harbor, ME or down to Key West, FL and it’s 2 mm annually. It’s about 6 mm in Ocean City, MD, about double the global average. It’s just 1.5 mm in Santa Monica, CA, and actually falling in Alaska.
What’s happening?
Along the mid-Atlantic there are two processes that are causing the land to sink – and thereby the water to appear to rise relatively faster.
First: groundwater is being pumped up for household use, like drinking and bathing, leaving the land to go down.
The other is the Laurentide Ice Sheet, which covered Canada, New England, and parts of the Midwest until about 20,000 years ago. The ice sheet was so thick and heavy, it pushed down the land beneath it and made land on the margins pop up. Imagine, said Horton, someone heavy sitting on an exercise ball.
“If you sit on that you’re compressing it and then around the margins you can see a lift. You get off the exercise ball, it pops up and area goes down.”
Same thing happens geologically, just more slowly.
Around the Hudson Bay in Canada, for example, land is rising, recovering from the weight of the ice sheet. South of the ice sheet, it’s sinking back down.
Similar processes are contributing to different relative sea level rise rates around the world.
Non-tectonic forces can also drive local divergence from global averages.
For example, some models predict climate change could potentially modify wind patterns, or the flow of major ocean currents, which both have the power to push water to or from certain coasts.
Then there’s gravity: large things with a large mass have gravitational pull. Take Greenland: it’s got a huge ice sheet, a lot of mass, and thusly it pulls water towards it.
When the ice sheet melts – which is already happening – that gravitational pull will weaken.
“Instead of water being pulled towards it, it won’t be pulled as much and will start to wash back into the ocean basins,” Horton said.
With the heavy ice sheet gone the land will also decompress, rise up.
“So when the Greenland ice sheet melts, the land pops up, the water moves away…sea level falls around Greenland, which is really counterintuitive,” Horton said.
These processes act on different time scales and affect different regions. Scientists have been modeling what the processes could mean for the future – how fast will water rise and where? But the global models aren’t completely reliable, yet, for looking at local variation.
Ronald Stouffer, a retired climate scientist who spent his career building climate models, said it’s a lot to ask of a model to account for everything from wind patterns to tectonics at a local scale.
Plus, models use a grid that is often too big to account for very local variations. Basically, Stouffer said, models aren’t sensitive enough, yet.
“They all say it’s going to go up but the details of how much and exactly and where don’t agree very much from model to model on small scales,” Stouffer said.
Models do consistently show that local sea level is predicted to go down around Antarctica, and it’s predicted to go up along the East Coast of North America, but there are still contradictions between models for other places.
The biggest agreement though, is seas are going up, up, up globally.
The Intergovernmental Panel on Climate Change, in its last report, put it this way: “By the end of the 21st century, it is very likely that over about 95% of the world ocean, regional sea level rise will be positive, and most regions that will experience a sea level fall are located near current and former glaciers and ice sheets. About 70% of the global coastlines are projected to experience a relative sea level change within 20% of the global mean sea level change.”
WHYY is your source for fact-based, in-depth journalism and information. As a nonprofit organization, we rely on financial support from readers like you. Please give today.
Brought to you by The Pulse
