


Why affordable housing also needs affordable transportation

Last week we looked at how cities’ choices about the allocation of street space can have an impact on equity. Another area of interest worth exploring in that realm is the idea of “location affordability.”
The topic of housing affordability has come up a lot this campaign season, but there’s a compelling case that it’s really a mistake to talk about housing costs in isolation.
You’ve heard the expression “drive ’til you qualify.” The idea is that if you can’t afford a house near your job or some nice amenity, then you should look farther afield because the housing will get progressively cheaper the greater distance you go.
At some point though, you’re also going to spend more time and money on transportation the farther out you get, so on some margin it makes sense to pay a bit more for housing in order to save on transportation.
As Wonkblog’s Emily Badger wrote, the Center for Neighborhood Technology’s H+T Index shows you roughly where that line is in different regions of the United States, and they have an interactive map that allows you to view the location affordability ranking for your neighborhood.
The standard definition of housing affordability says affordable housing should cost 30% of the area median income or less. CNT says transportation should cost no more than 15%, so an affordable location would be a place where your combined housing and transportation costs add up to no more than 45% of income.
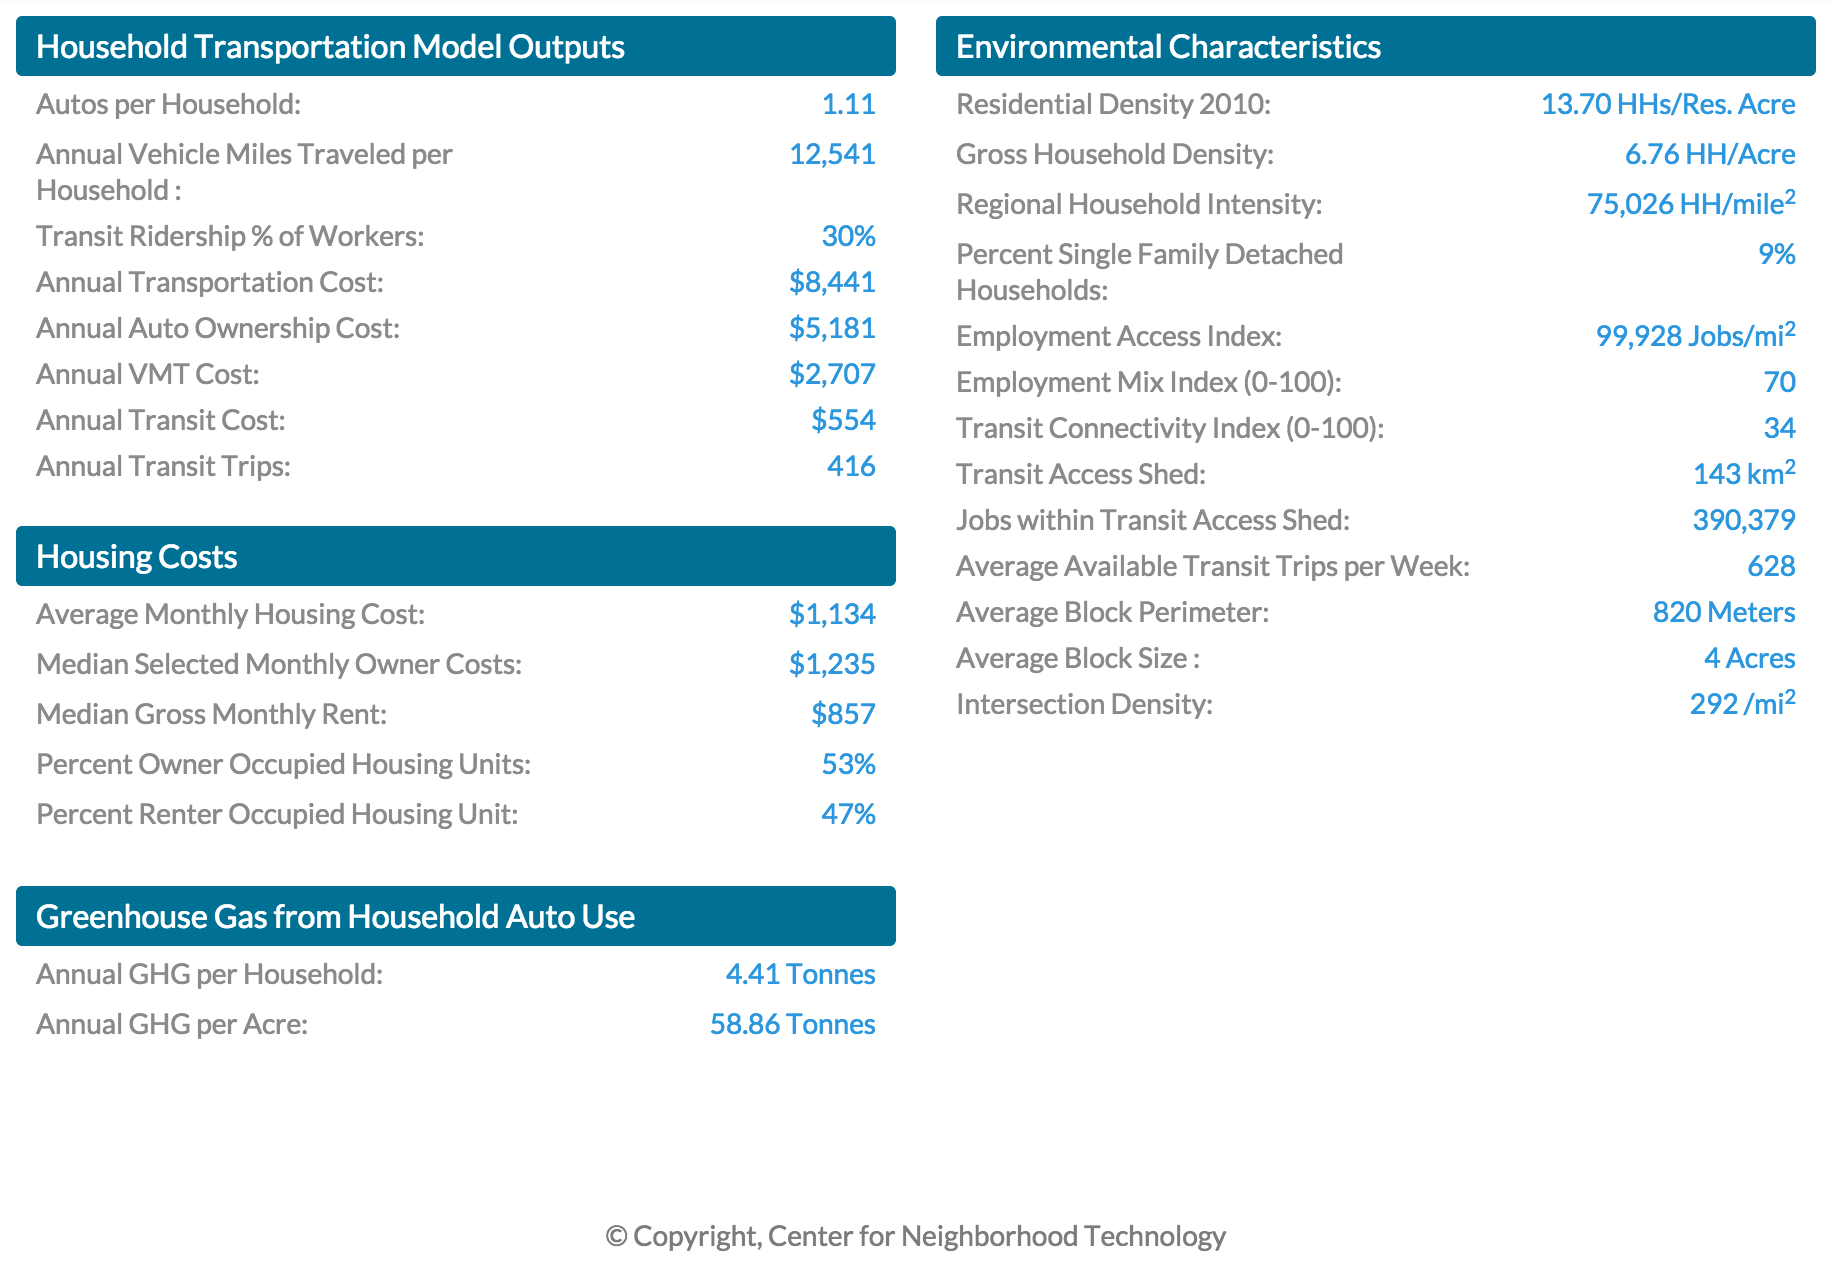
In my neighborhood in Bella Vista, housing costs are about 33% of area income, so a bit pricier than what’s considered affordable, but transportation costs are around 10%, so total H+T costs add up to 43% of area income.
They also compile data on many other factors relevant to housing and transportation affordability, and you can play with the maps and look at the H+T profiles for Census block groups, tracts, municipalities, counties, CBSAs, MPOs, and Congressional districts.
By CNT’s measure, 81% of Philadelphia’s neighborhoods are location-affordable, which they define as “places that are compact, close to jobs and services, with a variety of transportation choices, [and] allow people to spend less time, energy, and money on transportation.” The city’s housing costs eat up 22% of income, while transportation takes 14%. Combined, that’s 36%–well under CNT’s 45%.
That’s not the case everywhere in the city though. In one of the Census tracts around Chestnut Hill, for example, combined housing and transportation costs came in at 65% of income. Areas with higher concentrations of detached single-family homes further outside the frequent transit shed have higher transportation costs.
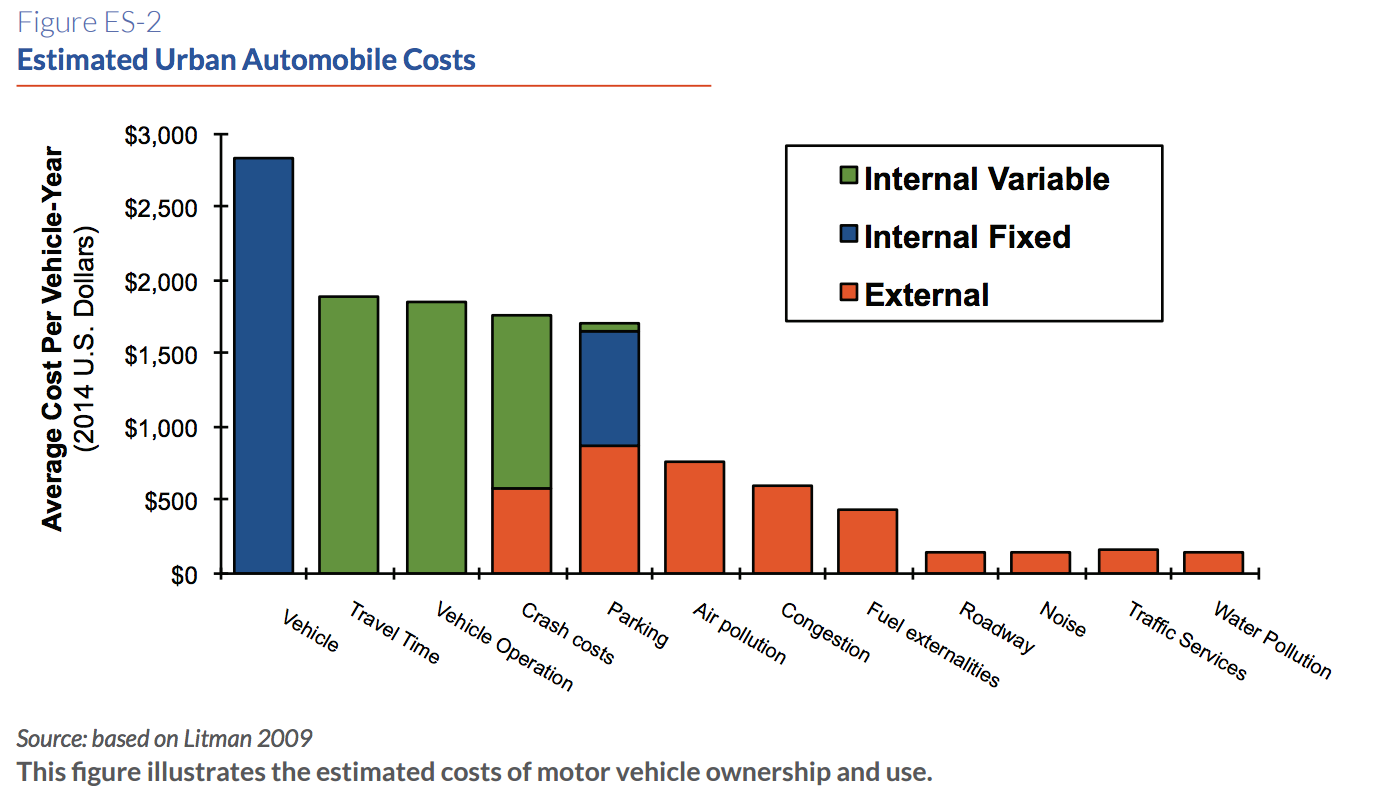
This is all pretty intuitive: the farther the distance between your home and your job, the more it’s going to make sense to own a car–a big annual expense at an average of $5,181 in Philly. What do transportation costs mean in this case? The Victoria Transport Policy Institute’s most recent paper on the costs of sprawl has a good breakdown:
The converse is that the denser and more integrated the concentration of residential and commercial places a place has, the more opportunities people will have to find a home near work that they can walk, bike, or take the bus to.
The US Department of Housing and Urban Development and the Department of Transportation worked with CNT to develop a Location Affordability portal that gives people the same information, so the idea has been increasing in popularity. What will be interesting to watch is how and whether the location affordability concept changes elected officials’ thinking about zoning, the role of streets policy in transit planning, and how and where to spend our affordable housing dollars.
WHYY is your source for fact-based, in-depth journalism and information. As a nonprofit organization, we rely on financial support from readers like you. Please give today.
Brought to you by PlanPhilly

PlanPhilly
In-depth, original reporting on housing, transportation, and development.

Ask Governor Meyer | WHYY & DPM | 04/30/2026
Delaware Governor Matt Meyer joins us to tackle issues like the long-awaited Port of Wilmington expansion, rising unemployment, and the rollout of legalized marijuana.
Air Date: April 30, 2026 8:00 pm
Listen 50:15
Ask Governor Meyer | WHYY & DPM | 03/26/2026
Delaware Governor Matt Meyer is back to discuss a potential school funding shake up, efforts to reign in soaring healthcare cost, and take questions from Delawareans.
Air Date: March 26, 2026 9:00 pm
Listen 50:30
Biden finalizes rule restoring broad environmental review of big projects
A rule finalized Tuesday will restore key provisions of the National Environmental Policy Act, a bedrock environmental law.
4 years ago