Philly’s homestead exemption has ‘outsized’ impact on tax burden for residents
The report from Pew Charitable Trusts uses federal and city data to compare the effective tax rates for renters and homeowners.
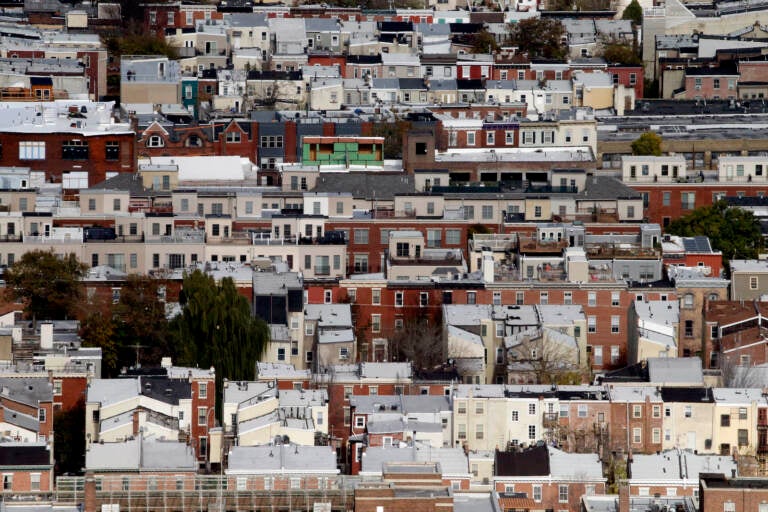
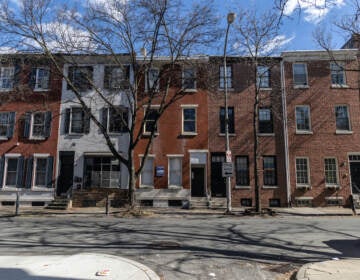
Rowhouses are seen Tuesday, Nov. 24, 2015, in Philadelphia. (AP Photo/Matt Rourke)
The effective tax rate for Philadelphia renters with the lowest income is roughly five times higher than it is for Philadelphia homeowners with the lowest income, according to new research from the Pew Charitable Trusts.
Released on Wednesday, the study found the tax burden for non-subsidized renters is 12.8% while the tax burden for homeowners with the lowest income is 2.5% — if they are enrolled in the city’s Homestead Exemption program. The popular incentive reduces the taxable portion of a homeowner’s property assessment by $80,000, an amount that exceeds the value of some houses.
“The city’s tax system is now somewhat progressive for owners and largely regressive for renters. That is, the tax burden goes up as your income goes down for the renters and the opposite way for the owners,” said Thomas Ginsberg, senior officer at Pew’s Philadelphia research and policy initiative.
The rate gap has the biggest impact on Black and Latino households, which account for two-thirds of the renters in the lowest-income group and the lowest-income homeowner group, according to the study.
It also shifted dramatically when the homestead exemption was not considered for homeowners.
“When you actually remove the homestead exemption for the model, all of the tax burdens change and go up quite a bit for the homeowners — almost to the point so that they are similar to the renters,” said Ginsberg.
For example, researchers found that without any form of property tax relief, the effective tax rate for homeowners with the lowest-income more than quadrupled from 2.5% to 11.2%. Under the same conditions, the effective tax rate on homeowners with the highest-income only rose half a percentage point, from 6% to 6.5%.
North and Southwest Philadelphia had the highest percentage of renters with the lowest income, defined as households earning about $6,500 a year. Upper North and Eastern North Philly had the highest percentage of homeowners with the lowest income, defined as households earning $12,000 a year.
Predictably, Center City had the highest percentage of homeowners with the highest income — $211,000 — and the highest percentage of renters with the highest income — $133,560.
Incomes were calculated by dividing homeowners and renters into five groups each: highest, second highest, middle, second lowest and lowest. The dollar amounts assigned to each group are the median for each quintile based on actual data from the U.S. Census Bureau.
The study considered the city’s wage, property, sales, and school taxes.

Subscribe to PlanPhilly
WHYY is your source for fact-based, in-depth journalism and information. As a nonprofit organization, we rely on financial support from readers like you. Please give today.
