FixPhillyDistricts: Voters offer winning visions for Council map
The way Philadelphia’s Council district map is drawn has real and lasting consequences for how and whether democracy works in the city.
If the map, up for revision this fall due to the 2010 Census, gets drawn as badly as it was in 2001, these are the likely results for the next 10 years:
Council elections will not be competitive.
Cozy incumbents won’t need to fear the lash of unhappy voters.
Neighborhoods will become splintered and confused, unclear which Council member to turn to in time of need.
The City Council faces a deadline this month to approve a new map, or risk losing salary. So it is racing to complete the task, with only perfunctory public input and little sunshine.
To create an avenue for meaningful public input, WHYY/Newsworks joined with some partners to sponsor a contest for the best voter-drawn maps of Council’s 10 districts. The partners were: Azavea, the mapping firm in town whose software enabled the contest; the Daily News editorial board, and the Penn Project for Civic Engagement.
Seven winning sets of lines
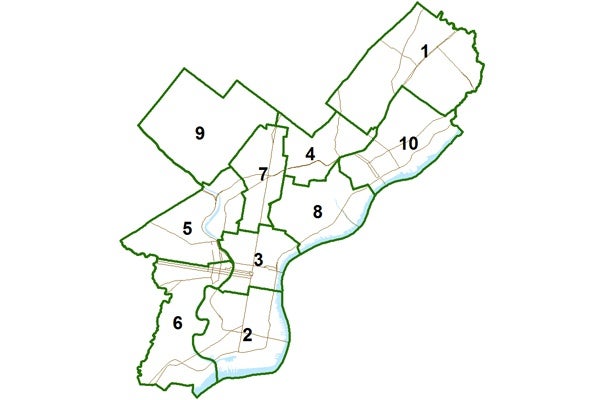
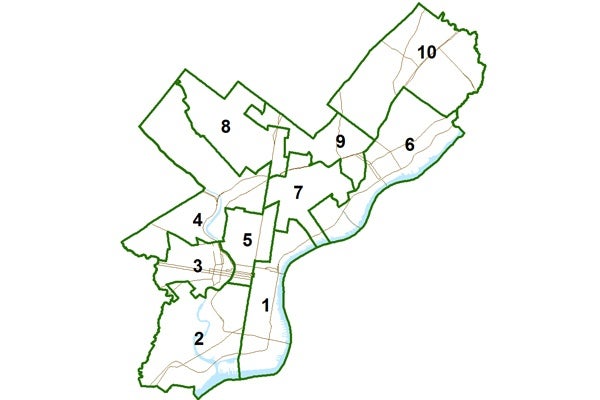
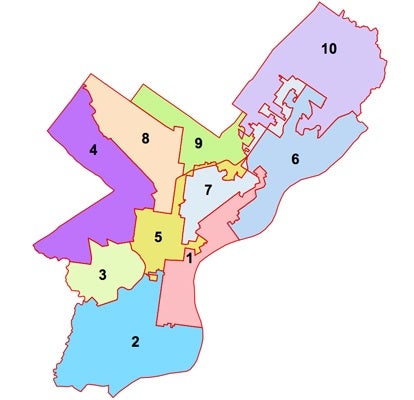
Today, we present seven maps, out of the 70 valid entries submitted, as winners of that contest. (See slideshow.) Tonight, we’ll present the winning maps to City Council at its final redistricting hearing, at 7 at Einstein Medical Center.
The overall winning map was submitted by John Attanasio of Philadelphia. He wins $500. The judges _ Robert Cheetham and Abby Fretz of Azavea, Sandy Shea and Doron Taussig of the Daily News, and me – felt that his map did the best job of balancing the goals of compactness and equal population among districts, while keeping most neighborhoods intact in a district, and dividing few political wards.
Here’s what Attanasio, a lawyer who works in the nonprofit field, had to say about the goals he sought to embody in his map:
“My plan places the highest value on compactness and community integrity. … I also sought to avoid splitting racial and ethnic communities. My plan thus has one district with a majority Hispanic voting age population. It also has four districts with a majority black voting age population. … No gerrymandering was required for these results.”
Attanasio also said, along with many others who submitted maps, that he paid no attention to a set of data that’s probably top of mind for Council members as they concoct their map: the home addresses of Council incumbents. “These are not in my view legitimate considerations for redistricting,” Attanasio wrote.
All maps were rated, according to Azavea formulas, on three criteria: compactness, that is avoiding jagged lines and keeping districts from sprawling; equal population among districts; and avoiding splits of wards and neighborhoods.
We also awarded prizes for the maps that did the best job on each of those criteria; these three winners will all receive Kindles.
They are:
Compactness: A team led by Frederic Murphy of Philadelphia, with Steven Kimbrough, Ram Gopalan and Nicolas Quintus.
Equal population: Cris Aquilar of Philadelphia. His plan, dubbed “Next Generation,” focused on preserving neighborhoods and respecting natural boundaries, such as watersheds.
Avoiding ward splits: Steve Horton of Philadelphia. Horton noted one of the embedded tensions of the exercise. In seeking to preserve wards, he found it very hard to keep population equal among districts, since ward lines no longer reflect the makeup of the city.
We also awarded three honorable mentions for maps that we thought pursued valid goals in interesting ways.
One was the product of a group effort. The Asian Pacific Americans for Progress team led by Andy Toy, a two-time Council candidate, sought to create a clear, compact map while enhancing the voting power of the city’s Asian community.
The other mentions went to Gary Zielonis of Erie, who said the contest gave him something o do while recovering from surgery, and Bonan Li of Philadelphia, whose plan strived to “preserve minority voting rights.”
Challenges and tensions
It was fascinating to see both the similarities among maps – as contestants struggled with some similar challenges – and the differences, as various maps upheld certain values or goals at the expense of others.
Some of the key challenges:
The immigrant-driven growth in Northeast Philadelphia’s population. No longer can you just create a “Northeast” district and a “river ward” district, and still meet the goal of balancing population. Compounding the challenge would be any desire to create an Hispanic majority district, since that population is concentrated in the lower Northeast or neighborhoods near there.
Do you keep Center City intact as one district? Contestants who live in the city’s vibrant center tended to want to do that, since they feel the way the current map divides Center City among three Council members ill serves its residents. Maps drawn by people from elsewhere were more likely to divide Center City, often at Broad Street. Some maps tried to pair west Center City up with University City (the eds and arts district?), while others tacked gentrifying neighborhoods such as Northern Liberties and Queen Village onto the center.
Do you try to keep like socioeconomic neighborhoods together, to create a clear voice for the dispossessed, or do you connect them to more affluent neighborhoods, which tend to have more clout?
The total of 70 entries that met all legal and contest requirements for a valid map does not convey fully the interest this project generated.
More than 100 people attended an information session on the Azaava software in August. More than 1,200 maps were started on FixPhillyDistricts.com by more than 400 people. Some people and teams did many maps before submitting to the contest the one they liked best.
For more detailed information on these winning maps, and all the others, go to www.FixPhillyDistricts.com.
WHYY is your source for fact-based, in-depth journalism and information. As a nonprofit organization, we rely on financial support from readers like you. Please give today.
