Voter turnout booms in ‘burbs, Philadelphia
We look at voter turnout in Southeast Pennsylvania...big numbahs.

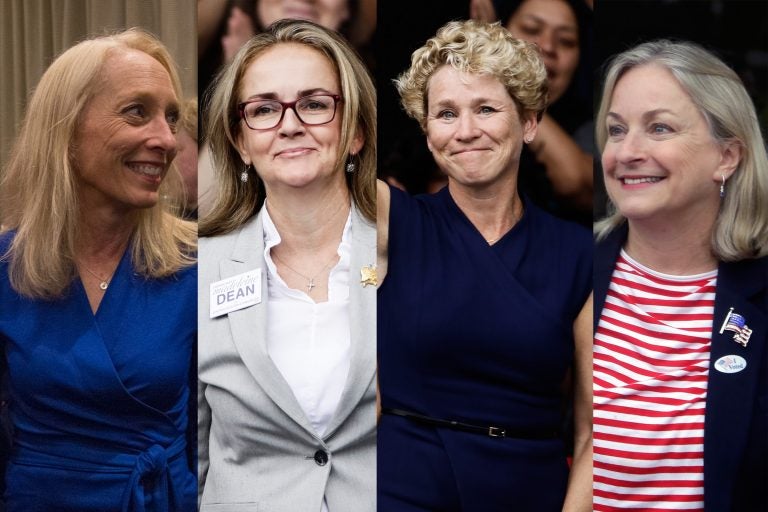
(From left) Mary Gay Scanlon, Madeleine Dean, Chrissy Houlahan, and Susan Wild, all Pennsylvania women who won their congressional bids during the 2018-midterm elections (Emily Cohen for WHYY; Matt Rourke/AP Photo; Matt Rourke/AP Photo; Jacqueline Larma/AP Photo)
Like other states, Pennsylvania experienced a high turnout in the midterm elections, a level more typical of presidential races.
Voter participation varied throughout the state, and nowhere was it more robust than in the Philadelphia suburbs.
If you rank Pennsylvania counties by their voter turnout, calculated as a percentage of citizens 18 and older, the top four counties in the state are Chester, Montgomery, Bucks and Delaware, all in the Philadelphia suburbs.
Roughly 64 percent of the voting age population turned out in Chester and Montgomery Counties, a whole lot more than McKean County in north central Pennsylvania, where just 38 percent showed (see chart below).
The statewide turnout of voting age citizens was 52 percent. The turnout of registered voters was a little higher, 58 percent.
Why were the suburbs so busy?
Of the four suburban counties, only Bucks had a really competitive congressional race.
But Dickinson College political scientist Sarah Niebler said in an interview that the frontrunners in the other counties’ Congressional races were all women, a history-making development in a state that until this month’s election had an all-male congressional delegation.
“Anytime there’s an opportunity to do something historic in an election, the potential for high turnout is there,” Niebler said.
She said there were also some heated state legislative races in the region to spur voter interest.
Did Philadelphia vote?
State data released last week showed Philadelphia’s turnout of registered voters, 52.5 percent, placed it 63rd among the state’s 67 counties, a pretty poor showing.
But Lisa Deely, co-chair of the Philadelphia City Commissioners, which runs elections, thinks that understates the city’s performance.
“Like any other large urban area, we have a high number of renters, and a fairly transient population,” Deely said, “and we’re also blessed to have several universities in the city.”
Deely said that makes Philadelphia voter rolls “a little heavy” compared to other areas, meaning the city has relatively more people registered who no longer live at the address in the voter registry.
If you calculate turnout based on the number of citizens of voting age, rather than registered voters, the city’s relative performance improves.
The city ranked 14th among the state’s 67 counties by that standard.
“Considering the real lack of competitive elections in Philadelphia, our turnout was fantastic,” Deely said.
Just under 50 percent of the city’s voting-age citizens voted on November 6.
| County | Turnout as % of citizens over 18 | Turnout as % of registered voters |
| CHESTER | 64.37% | 66.22% |
| MONTGOMERY | 63.84% | 67.59% |
| BUCKS | 62.11% | 64.39% |
| DELAWARE | 58.36% | 59.95% |
| ALLEGHENY | 56.31% | 57.54% |
| CUMBERLAND | 56.09% | 61.17% |
| BUTLER | 55.00% | 62.38% |
| DAUPHIN | 54.25% | 59.08% |
| LANCASTER | 51.49% | 61.66% |
| LACKAWANNA | 51.22% | 58.83% |
| YORK | 50.97% | 55.84% |
| WESTMORELAND | 50.77% | 59.50% |
| SULLIVAN | 50.69% | 63.07% |
| NORTHAMPTON | 50.67% | 55.83% |
| BEAVER | 50.64% | 61.75% |
| WASHINGTON | 50.42% | 58.85% |
| ADAMS | 50.10% | 58.58% |
| PHILADELPHIA | 49.89% | 52.52% |
| MONTOUR | 49.19% | 53.30% |
| PERRY | 49.14% | 60.83% |
| WYOMING | 48.46% | 63.41% |
| WAYNE | 48.38% | 60.70% |
| PIKE | 48.34% | 49.54% |
| LEHIGH | 48.30% | 54.47% |
| ERIE | 48.26% | 53.43% |
| CENTRE | 48.20% | 54.86% |
| LEBANON | 48.06% | 57.85% |
| BEDFORD | 48.04% | 58.97% |
| SUSQUEHANNA | 48.02% | 62.13% |
| FRANKLIN | 47.94% | 59.62% |
| BERKS | 47.63% | 56.80% |
| SOMERSET | 46.94% | 61.77% |
| POTTER | 46.77% | 58.91% |
| FULTON | 46.67% | 58.88% |
| LAWRENCE | 46.35% | 59.38% |
| ARMSTRONG | 46.04% | 60.29% |
| ELK | 45.91% | 59.05% |
| MERCER | 45.87% | 58.20% |
| CAMERON | 45.46% | 61.31% |
| CAMBRIA | 45.45% | 60.22% |
| CLARION | 45.35% | 62.14% |
| JUNIATA | 45.34% | 62.24% |
| LYCOMING | 45.21% | 60.61% |
| WARREN | 45.18% | 48.51% |
| CARBON | 44.66% | 52.87% |
| MONROE | 44.44% | 51.86% |
| VENANGO | 44.29% | 59.79% |
| BLAIR | 44.28% | 57.97% |
| LUZERNE | 44.05% | 52.53% |
| SNYDER | 43.89% | 62.60% |
| BRADFORD | 43.53% | 57.17% |
| CRAWFORD | 43.43% | 56.04% |
| HUNTINGDON | 43.35% | 53.25% |
| JEFFERSON | 43.23% | 50.84% |
| TIOGA | 42.88% | 53.50% |
| SCHUYLKILL | 42.61% | 57.31% |
| CLEARFIELD | 42.22% | 57.70% |
| COLUMBIA | 42.22% | 59.00% |
| INDIANA | 41.76% | 59.76% |
| GREENE | 41.62% | 57.82% |
| MIFFLIN | 40.55% | 58.85% |
| CLINTON | 40.39% | 60.34% |
| UNION | 40.37% | 60.61% |
| NORTHUMBERLAND | 39.16% | 55.41% |
| FAYETTE | 38.57% | 52.94% |
| MCKEAN | 37.58% | 53.13% |
| FOREST | 27.44% | 58.74% |
| PENNSYLVANIA | 51.74% | 58.44% |
WHYY is your source for fact-based, in-depth journalism and information. As a nonprofit organization, we rely on financial support from readers like you. Please give today.


