


Single-use residential properties make up 79% of Philly properties, and other things we learned from the new OPA data

The Office of Innovation and Technology has been upping the city’s data visualization game for a while now, and the latest release of Office of Property Assessment data is everything a data dump should be.
Rather than giving you a context-free spreadsheet only a data scientist could love, we get a real information product that comes with some visuals that get directly at some of the reasons why someone would care about having this information, as well as some tools to manipulate and analyze it.
Here are just a few of the interesting findings from the Official Data Lens site that came with the release:
RSA-5 is the most common zoning classification
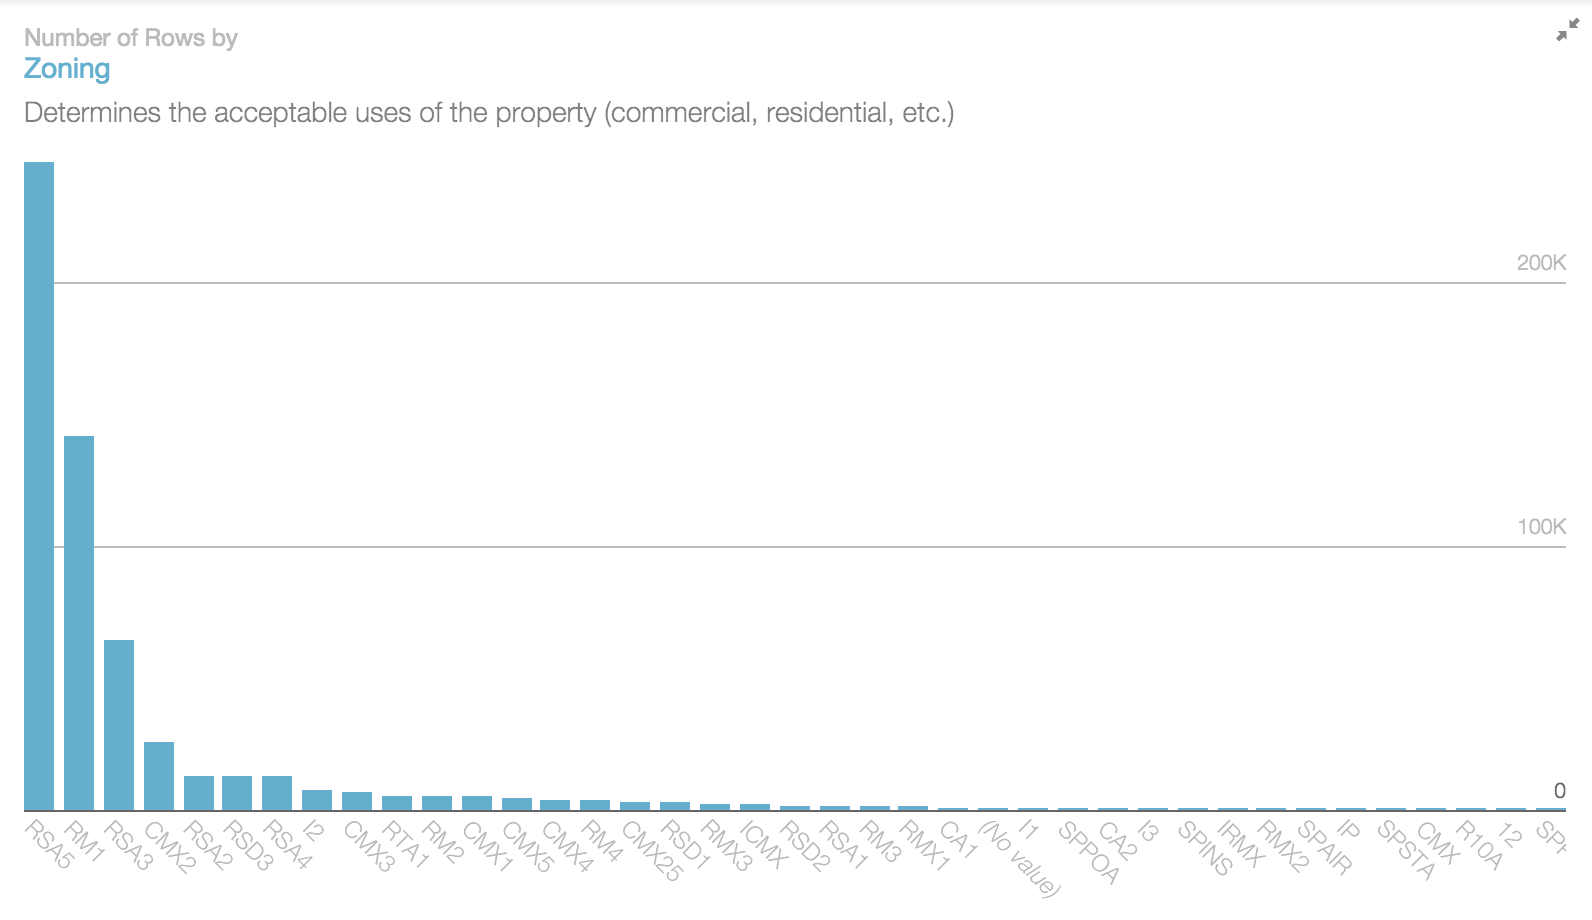
The way to read this is that each property has its own row, so the visualization is counting up how many properties have each type of zoning classification.
What we see is that RSA-5 (the typical neighborhood rowhouse) is the most common zoning classification by far, accounting for about 42% of all properties. The RM-1 category, which is similar similar to RSA-5 but allows multi-family, makes up about 24% of properties.
RSA-3, which allows small twin-homes like you might find in parts of West Philly, accounts for 11%, and the fourth most popular classification is CMX-2 (the typical neighborhood retail space with apartments on top) which comes in way down at 4%. We don’t encounter another mixed-use category (CMX-3) until ninth place in the rankings.
Single-use residential zoning rules the land
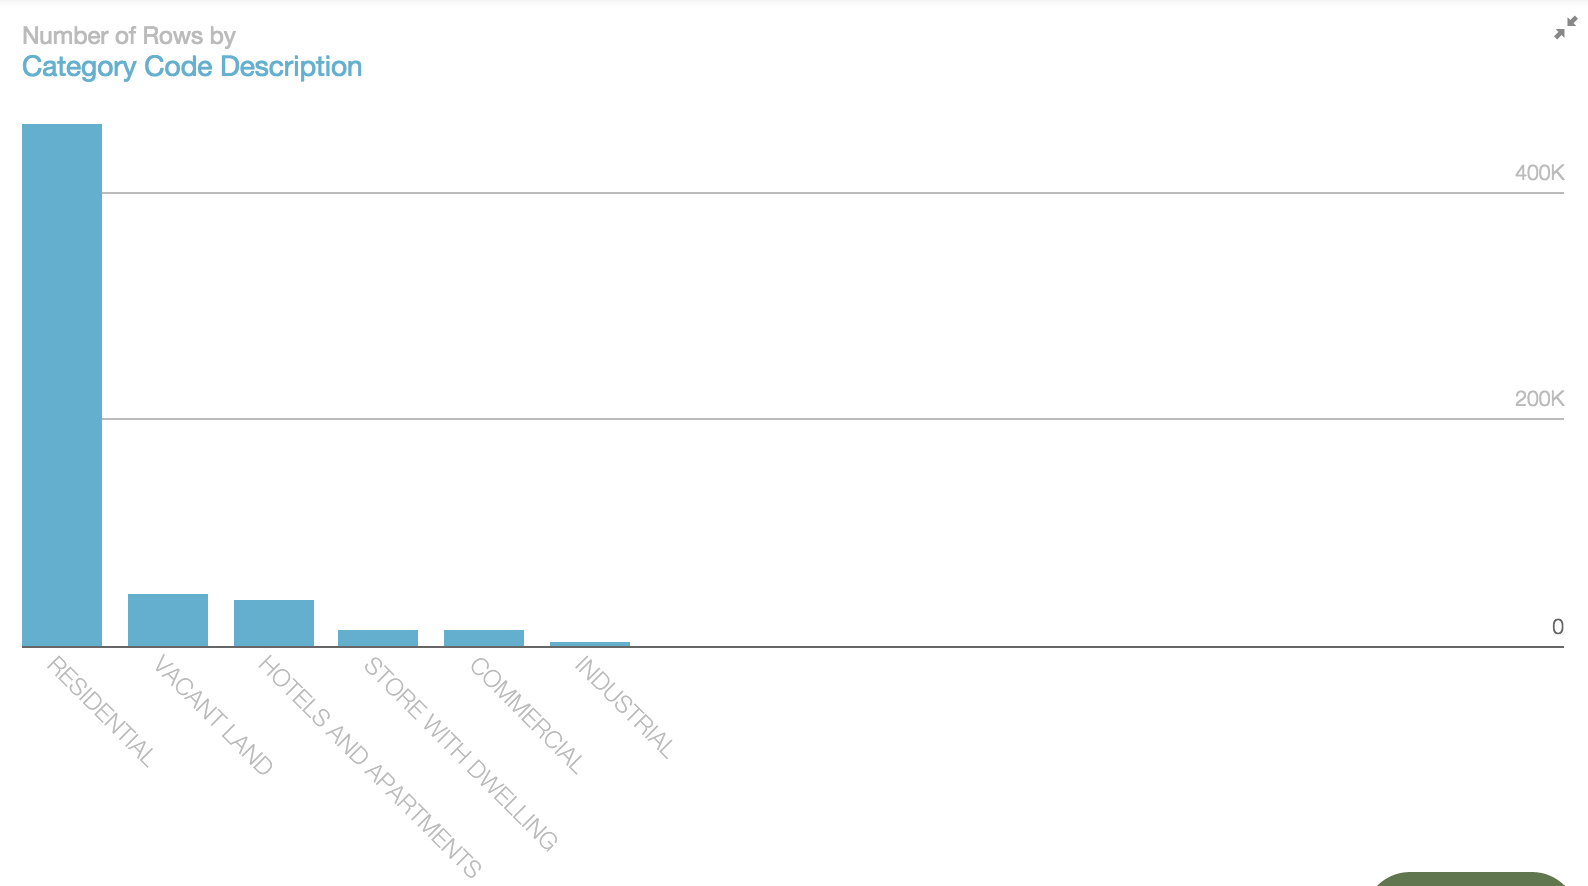
The above two visualizations do a good job of quantifying one of the main trends that jumps out when you look at the zoning map, which is that on the overwhelming majority of Philadelphia’s land area, it’s illegal to build anything besides a single-use residential structure.
Residential-only properties are 79% of the total, and hotels and apartments, stores with dwellings, and commercial properties make up just 12% of properties combined. About 8% of properties are vacant land, and industrial properties account for just .7% of the total. In recent years there’s been a lot more mixed-use construction, but put in this perspective, you see how rare it actually is.
People built a crazy number of buildings in the 1920s
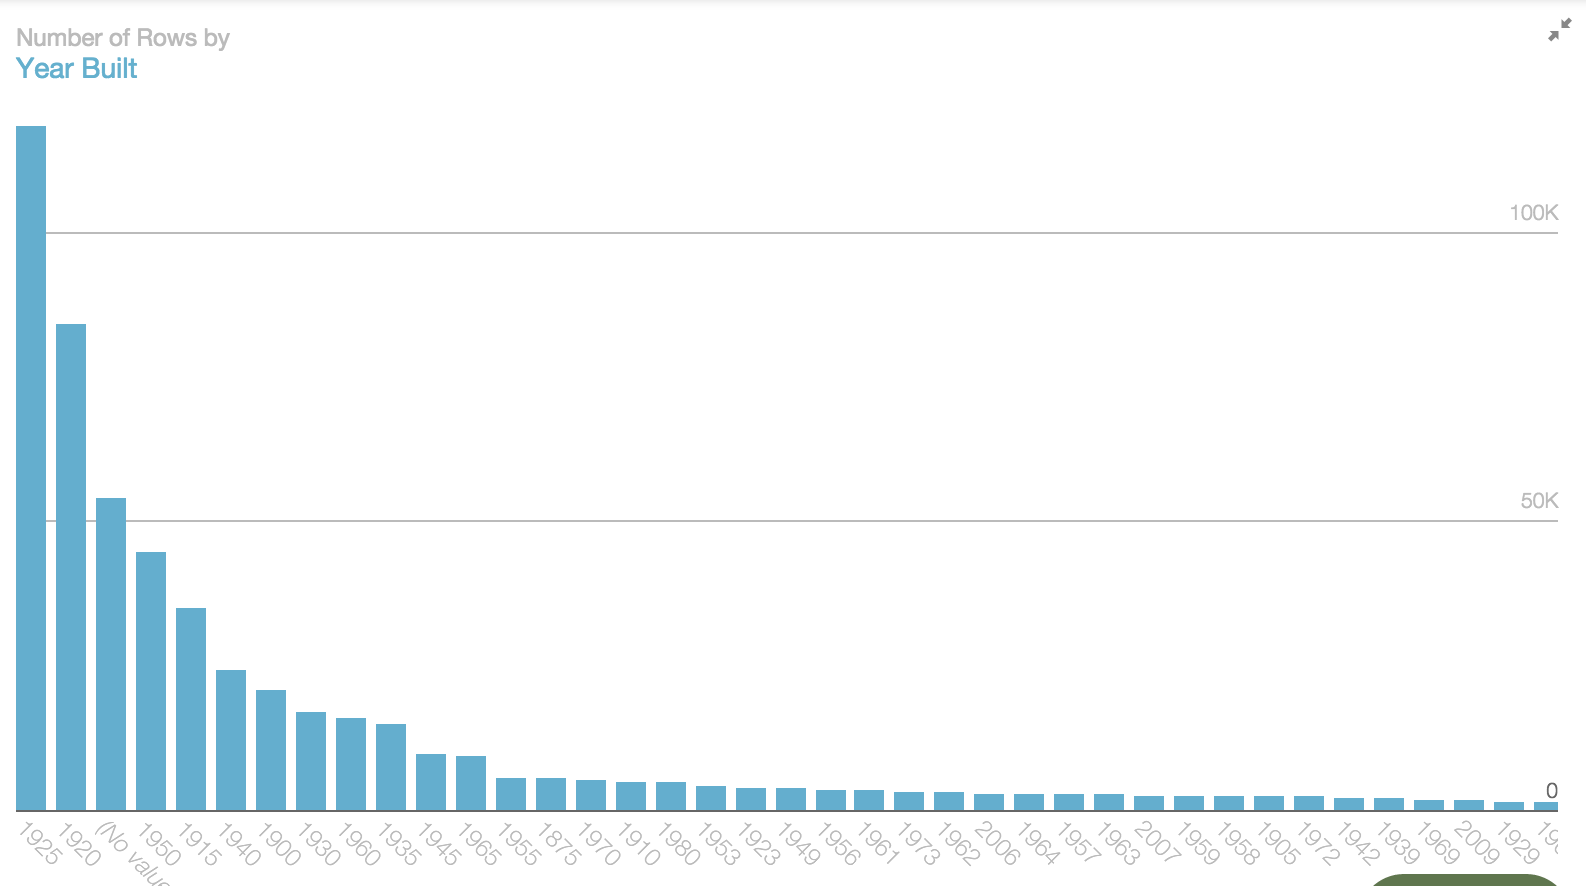
If the current pace of home-building seems like a lot, consider that OPA’s records say 118,182 of Philadelphia’s recorded properties were built in 1925 alone. That’s 20% of all currently existing structures! Combined with the previous big boom year, 1920, in which over 83,000 properties were built, and a smaller boom in 1923 that produced 3,834 homes, the first half of the 1920’s saw the production of about 35% of the structures currently standing in Philadelphia.
Philadelphia experienced a number of building booms in the 40 years on either side of the turn of the century, at a volume that would make even Paul Levy queasy. But the records probably aren’t all that clean, so take some of these yearly totals like the 1925 number with a grain of salt. Note, for instance, how the third-largest category is “no value.”
Still, these boom periods make the current rate of construction look like a tiny blip. The year 2014 saw the production of just 596 new properties, and ranked 74th on the list. The highest ranking recent year is 2006, in 25th place, with 2,933 properties. That’s a lot of properties, but it’s still less than we were building even during some of the big population decline years like 1970, 1973, and 1980. Bookmark these numbers for the next time you see someone wondering if Philly’s in a housing construction bubble.
Check out the OPA site to play with these and other visualizations, all of which are interactive over there.
Jared Brey contributed blogging to this article.
WHYY is your source for fact-based, in-depth journalism and information. As a nonprofit organization, we rely on financial support from readers like you. Please give today.
Brought to you by PlanPhilly

PlanPhilly
In-depth, original reporting on housing, transportation, and development.

A vacant church in Philadelphia’s Strawberry Mansion will become workforce housing
The $10 million project will reuse Cornerstone Baptist Church on North 33rd Street. The property has sat vacant for more than five years.
3 days ago
Listen 0:45
Thousands of West Philly tenants remain in limbo as city considers saving 925 affordable rentals
The city missed its exclusive window to bid on the homes, opening the door to outside buyers and possible displacement.
4 days ago
Listen 1:12
South Jersey woman opts for mediation in eminent domain fight over her Whitesboro property
Dawn Robinson has been fighting efforts from the city to force her to sell her 2.4-acre property in Middle Township.
2 weeks ago
Listen 0:57