

Achievement gaps widen under new Delaware test, if only slightly


State officials say the news could have been worse.
African American and Latino students scored significantly worse than their white peers on Delaware’s new state standardized test, known as Smarter Balanced. The achievement gap between minority students and white students was also noticably larger on the new test than it was on the old assessment.
The same held true for low-income students, who scored below their higher-income peers–and by a larger margin than last year.
That’s according to data released Thursday by the Delaware Department of Education.
Take, for instance, the gap between the percetange of African-American students and white students deemed proficient in English by Smarter Balanced, which measures students on their mastery of the Common Core standards and is significantly tougher than previous assessments.
Last year, the gap was 23.33 percentage points. This year, with the new test, the gap was 27.34 percentage points. That difference represents a 17 percent increase in the achievement gap between black and white students in English.
State officials, however, downplayed the increases and said they feared the results would show an even steeper growth in racial disparities.
“We see the same gaps, the same approximate achievement,” said Penny Schwinn, the state’s Chief Accountability and Performance Officer. Schwinn admitted, though, that “the gaps remain significant.”
Alison May, a spokesperson for the Department of Education, echoed Schwinn’s sentiment.
“Generally speaking, gaps at the aggregate level did not significantly increase,” wrote May in an e-mail. “This is in contrast to what some other places have seen.”
May said the state’s “most important message” is that significant gaps remain, and that “we as a state have much more work to do to ensure every child graduating from our system is prepared for success after school.”
The chart below shows the percentage point gaps between African American and White students on this year’s English language test versus last year. It also shows the percentage point gaps between Latino and White students, English language learners and non-English lanaguage learners, and low-income students and non-low income students.
(Note: The achievement gap is the difference between the number of students who are deemed proficient.)
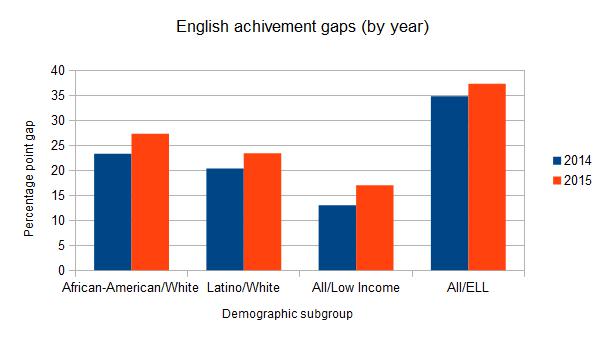
Note that the percentage point gaps increased noticeably this year for all of the above subgroups (an increase, in this case, is a bad sign).
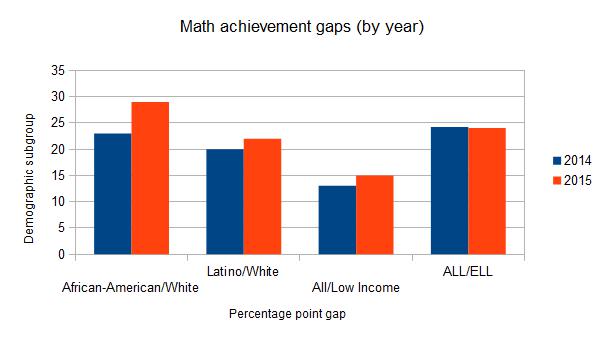
A similar trend emerged on the new mathematics exam. Achievement gaps ticked upward in 2015 for most subgroups. Although you’ll see that the gap narrowed modestly for English language learners.
There was one major exception to this otherwise somber trend. Students with disabilities closed the gap on their peers by a significant margin. See the chart below.
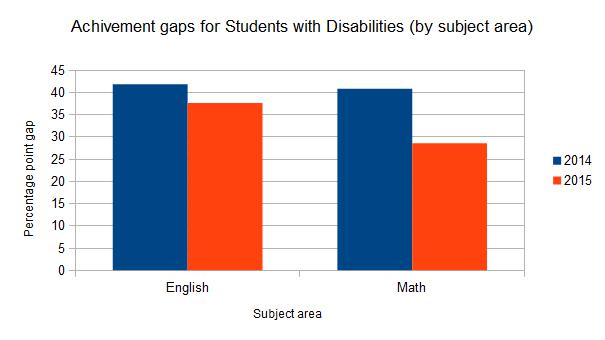
This would seem like cause for major celebration–and it may yet be. But for the moment, state officials are keeping a cautious tone. That’s because the definition for students with disabilities changed between 2014 and 2015. The 2015 definition roped in certain subgroups, such as students with speech impairments, that tend to perform as well as their peers on state assessments.
The new Smarter Balanced assessment was given for the first time this year in 18 states and is supposed to measure how well students have mastered the Common Core State Standards. In Delaware, it replaced the Delaware Comprehensive Assessment System (DCAS).
The test is tougher than its predecessor, and proficiency scores overal dropped compared to 2014. Scores for African American students, Latino students, and low-income students, however, dropped further than those of their white peers.
That data would suggest that the transition to Common Core standards has been smoother for white students than it has for minority and low-income students in Delaware schools.
For a full look at how the achivement gaps in proficiency changed from 2014 to 2015, check out the tables below.
| Subject Area: English | 2014 Achivement Gap | 2015 Achievement Gap | Percentage Point Difference |
| All Grades | |||
| African-American/White | 23.33 | 27.34 | 4.01 |
| Latino/White | 20.36 | 23.44 | 3.08 |
| All/Students with Disabilities | 41.89 | 37.63 | -4.26 |
| All/Low-income | 13.04 | 17.03 | 3.99 |
| All/ELL | 34.8 | 37.32 | 2.52 |
| Subject Area: Math | 2014 Achivement Gap | 2015 Achievement Gap | Percentage Point Difference |
| All Grades | |||
| African-American/White | 26.79 | 28.79 | 2 |
| Latino/White | 18.21 | 21.83 | 3.62 |
| All/Students with Disabilities | 40.89 | 28.62 | -12.27 |
| All/Low-income | 13.05 | 14.98 | 1.93 |
| All/ELL | 24.23 | 24.03 | -0.2 |
WHYY is your source for fact-based, in-depth journalism and information. As a nonprofit organization, we rely on financial support from readers like you. Please give today.