

These 10 Philly neighborhoods show promise for reduced rates of violent crime

Last month, WHYY’s Holly Otterbein analyzed how violent crime statistics changed across Philadelphia between 2012 and 2013. Here is a list of the 10 areas of the city that saw the largest decrease in the rate of violent crime.
Violent crime was down in the city as a whole, but some neighborhoods saw a decrease in one area and an increase in another — as can be seen below in our interactive map.
The map analysis looks at census tracts — small geographic areas used in Census calculations — and shows the changes in the number of crimes per 1,000 residents, a standard measure. Census tracts don’t correspond neatly to neighborhoods, so we can only indicate neighborhoods that are affected by the decrease. And the change in any area over a period of one year doesn’t indicate a trend. But this does represent some good news for many Philadelphia residents.
(All numbers from 2013. Not all map details are at the same scale.)
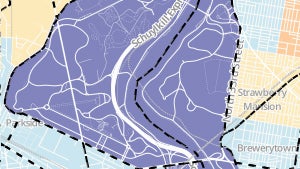 1. Fairmount Park
[Census tract 9800] Fairmount Park, which had a relatively low population of about 600 in 2013, experienced a decrease of 31.6 violent crimes per 1,000 residents — a decrease of approximately 19 incidents.
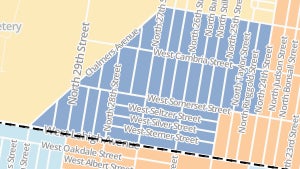
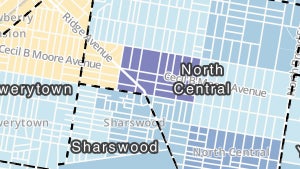 2. North Central
[Census tract 148] North Central Philly has an area running along Cecil B. Moore Avenue between 19th and 23rd streets that saw a decrease of 24.2 crimes per 1,000 residents. With a population of 785, the area saw an approximate decrease of 19 incidents of violent crime.
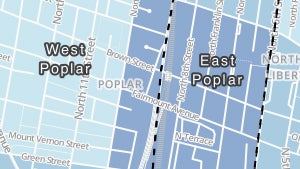 3. East Poplar/West Poplar
[Census tract 131] An area comprising much of East Poplar and a small slice of West Poplar (the area where Poplar meets Northern Liberties), population 1,529, saw a decrease of 15.7 violent crimes per 1,000 residents. That’s about 24 crimes.
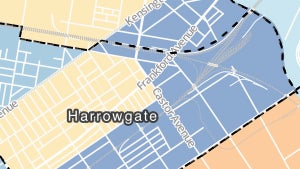 4. Harrowgate/Juniata Park
[Census tract 382] An area comprising about half of Harrowgate and a small slice of Juniata Park, population 2,631, saw a decrease 14.8 per 1,000 residents. That’s about 39 incidents.
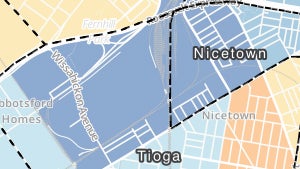 5. Tioga/Nicetown
[Census tract 205] Violent crime in an area that crosses between Tioga and Nicetown and includes small slices of SW Germantown and Logan decreased by 14.2 incidents per 1,000 residents. With a population of 2,819, that amounted to 40 fewer violent crimes than the year before.
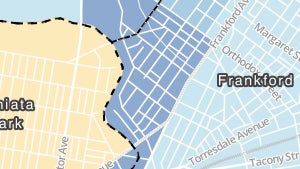 6. Frankford
[Census tract 293] A small area in southwestern Frankford, population 2,891, saw a decrease of 12.4 incidents per 1,000 residents — down about 36 violent crimes from the previous year.
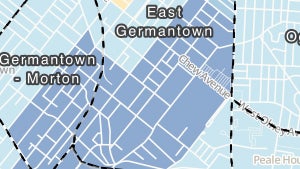 7. East Germantown
[Census tract 247] Incidents of violent crime in a section of East Germantown with a population of 4,423 decreased 10.9 per 1,000 people, or about 48.
 8. Allegheny West
[Census tract 172.02] A small part of Allegheny West, pop. 4,056, saw a drop of 9.9 violent crimes per 1,000 residents. That’s about 40 fewer incidents than the year before.
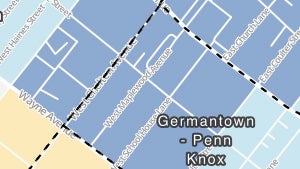 9. Germantown – Penn Knox
[Census tract 241] Part of Germantown – Penn Knox with 1,433 residents saw a decline of 9.8 violent crimes per 1,000, an approximate decrease of 14.
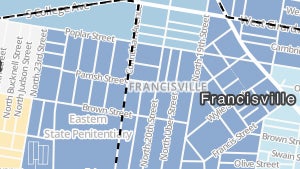 10. Francisville/Fairmount
[Census tract 135] A segment of the city crossing between Francisville and Fairmount saw a decline of 9.6 incidents per 1,000 people. With a population of 3,222, that amounts to about 31 fewer violent crimes than the year before.
—
NewsWorks will be revisiting these statistics next year to see how 2014 stacks up and what progress the police department is making with continued efforts to reduce crime.
WHYY is your source for fact-based, in-depth journalism and information. As a nonprofit organization, we rely on financial support from readers like you. Please give today.

Urban wildlife – from coyotes to bats, Bakari Sellers ‘The Momentum’, Daniel’s Law
It’s getting wild. We talk about urban wildlife – from encounters with coyotes to bats who need our help
Air Date: April 25, 2024 12:00 pm

Photo essay: Primary Election Day 2024 in the Philly region
Here's a look at some of the scenes that unfolded on Election Day, in photos.
6 hours ago

Bridging Blocks: Philly’s ‘missing middle’ wage jobs make career matchmaking harder, residents say
For a city of its size, Philadelphia has fewer middle-wage jobs than New York City, Baltimore, Nashville and D.C., research from The Pew Charitable Trusts shows.
11 hours ago
Listen 1:07